Genetic dissection of the oncogenic mTOR pathway reveals druggable addiction to translational control via 4EBP-eIF4E - PubMed (original) (raw)
Genetic dissection of the oncogenic mTOR pathway reveals druggable addiction to translational control via 4EBP-eIF4E
Andrew C Hsieh et al. Cancer Cell. 2010.
Abstract
We genetically dissect the contribution of the most prominent downstream translational components of mTOR signaling toward Akt-driven lymphomagenesis. While phosphorylation of rpS6 is dispensable for cancer formation, 4EBP-eIF4E exerts significant control over cap-dependent translation, cell growth, cancer initiation, and progression. This effect is mediated at least in part through 4EBP-dependent control of Mcl-1 expression, a key antiapoptotic protein. By using an active site inhibitor of mTOR, PP242, we show a marked therapeutic response in rapamycin-resistant tumors. The therapeutic benefit of PP242 is mediated through inhibition of mTORC1-dependent 4EBP-eIF4E hyperactivation. Thus, the 4EBP-eIF4E axis downstream of mTOR is a druggable mediator of translational control and Akt-mediated tumorigenesis that has important implications for the treatment of human cancers.
Copyright 2010 Elsevier Inc. All rights reserved.
Figures
Figure 1. The Ability of PI3K-Akt-mTOR Signaling to Augment Protein Synthesis Is Necessary for Its Oncogenic Potential
(A) Schematic representation of the PI3K-Akt-mTOR pathway and the genetic strategy to restore protein synthesis to normal levels using a mouse minute mutant, haploinsufficient for ribosomal protein L24. (B) Cell size analysis of thymocytes from the indicated genotypes (**p < 0.00001; *p < 0.0009, n > 5/genotype). (C) Protein synthesis levels in thymocytes measured by [35S]-methionine incorporation and TCA precipitation. The graph represents percentage of increase over WT levels (n = 6/genotype). *p = 0.0006 and **p = 0.008. (D) Transgenic CMV-Cap-HCV-IRES animals harboring a translational dicistronic luciferase reporter. (E) CMV-Cap-HCV-IRES mice were crossed with AKTT and cap-dependent translation (Renilla luciferase activity) and IRES-mediated translation (Firefly luciferase activity) were measured (n = 3/genotype, p = 0.004; n.s., no statistical significance). (F) Kaplan-Meier curve showing lymphoma-free survival in AKTT (n = 19) and AKTT;L24+/− (n = 14) mice (p = 0.0006). Data are presented as the average ± SEM. See also Figure S1.
Figure 2. Phosphorylation of 4EBP1, but Not rpS6, Is Required for Increased Protein Synthesis and Cell Size Control Downstream of Oncogenic Akt Signaling
(A) Schematic representation of the PI3K-Akt-mTOR pathway and the genetic strategy to specifically inhibit rpS6 phosphorylation or eIF4E hyperactivation. (B) Representative western blot analysis showing the hyperphosphorylation status of pAkt, p4EBP1, and prpS6 in AKTT thymocytes. Western blot analysis of total Akt, 4EBP1, and rpS6 in AKTT thymocytes is included. (C) A representative cap-binding assay to analyze eIF4E-eIF4G complex formation in thymocyte cell lysates of WT, AKTT, AKTT;4EBP1M, and 4EBP1M mice and densitometry of eIF4G/eIF4E ratio (n = 3/genotype) (*p < 0.05; n.s., no statistical significance). The eIF4E complex bound to the cap analog m7GTP-sepharose was pulled down and western blotted with antibodies against eIF4G and 4EBP1 revealed the relative amounts of eIF4E-associated proteins. The anti-4EBP1 antibody recognizes both the endogenous 4EBP1 and the 4EBP1M proteins. (D) Protein synthesis rates in thymocytes derived from AKTT, AKTT;4EBP1M, and AKTT;rpS6P−/− mice were measured by [35S]-methionine incorporation and TCA precipitation represented as percentage of increase over WT levels; *p = 0.0006; **p = 0.001, n > 6/genotype. (E) Cell size analysis of thymocytes from the indicated genotypes; **p < 0.00001, n = 8; *p < 0.0007, n = 6. Data are presented as the average ± SEM. See also Figure S2.
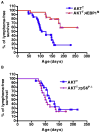
Figure 3. Hyperactivation of eIF4E Is Essential for T Cell Lymphomagenesis Downstream of Oncogenic PI3K-Akt-mTOR Signaling, while Phosphorylation of rpS6 Is Dispensable
Kaplan-Meier analysis of lymphoma-free survival in two independent cohorts of AKTT (n = 26) and AKTT;4EBP1M (n = 25) mice (A), p = 0.0001, and AKTT (n = 19) and AKTT;rpS6P−/− (n = 18) mice (B), p = 0.3319. See also Figure S3.
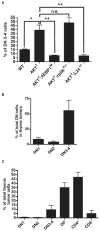
Figure 4. Oncogenic PI3K-Akt-mTOR Signaling Leads to Enrichment of the DN3-4 Thymic Subpopulation, which Is Dependent on eIF4E Hyperactivity
(A) Percentage of DN3-4 thymocytes (prior to tumor formation compared to total DN thymocytes) in the thymus, as assessed by flow cytometry (n > 5/ genotype) (*p < 0.003; **p < 0.002; and n.s., no statistical significance). (B) Percentage of DN cell subsets in thymic tumors from AKTT mice (n = 5). (C) Flow cytometry analysis of all thymocyte subpopulations in thymic tumors from AKTT mice (n = 5). Data are presented as the average ± SEM. See also Figure S4.
Figure 5. eIF4E Hyperactivation Downstream of Oncogenic PI3K-Akt-mTOR Signaling Impairs Programmed Cell Death of Specific T Cell Precursors, at Least in Part, through Control of Translation of Mcl-1
(A) Percentage of Annexin V+ DN3-4 cells prior to tumor formation (n > 3 mice/genotype) (*p < 0.001, **p < 0.02, and ***p < 0.003). (B and C) Analysis of Mcl-1 protein expression levels in total thymocytes. (Right) Representative western blot. (Left) Densitometry analysis (*p = 0.005). All representative western blots were loaded, resolved, and transferred from the same gel. (D) Percentage of increase of Mcl-1 expression in AKTT and AKTT;4EBP1M in the DN3-4 compartment compared to WT controls (n = 4/genotype) (*p = 0.01). (E) Fold change of Annexin V+ in DN3-4 cells after knockdown of Mcl-1 (n > 3 mice/genotype) (*p < 0.01 and n.s., no statistical significance). Data are presented as the average ± SEM. See also Figure S5.
Figure 6. eIF4E Hyperactivation Is Important for AKTT Tumor Maintenance
4EBP1M was induced in AKTT;4EBP1M mice at 10 weeks of age. (A) Average tumor volumes (p < 0.03). Data are presented as the average ± SEM. (B) AKTT and AKTT;4EBP1M mice that were imaged in a GE 3T MRI at 10 and 14 weeks. Images from the same AKTT and AKTT; 4EBP1M mouse at 10 and 14 weeks.
Figure 7. PP242, but Not Rapamycin, Has a Significant In Vivo Anti-Tumor Effect on AKTT Tumor Allografts
(A) AKTT thymocytes were injected subcutaneously and allowed to form tumors for 20 days. 30 tumor-bearing mice were randomized into three groups of 10: vehicle, 5 mg/kg rapamycin, or 100 mg/kg PP242. Treatments were given 7 days a week for 20 days. (B) Representative mice from each cohort after 20 days of therapy. Dotted yellow lines, primary tumor; dotted green lines, multiple sites of lymph node metastasis; green arrows (inset), areas of significant cervical lymphadenopathy. (C) Tumor areas in square millimeters. Black line, vehicle; blue line, rapamycin; red line, PP242. (D) Mouse weights in grams during the course of treatment. Data are presented as the average ± SEM.
Figure 8. PP242 Shows a Better Therapeutic Effect Than Rapamycin In Vivo, at Least in Part, through Inhibition of the 4EBP-eIF4E Axis
(A) Pharmacodynamic analysis of mTOR targets through western blot analysis. Each lane represents one post-treatment tumor 20 days after initiation of therapy. (B) Protein synthesis levels in tumor thymocytes treated with DMSO, rapamycin (50 nM), and PP242 (2.5 μM) ex vivo for 2 hr measured by [35S]-methionine incorporation and TCA precipitation (n = 6/genotype) (*p = 0.001 and **p = 0.001). (C) Fold decrease in cell survival compared to WT as determined by propidium iodide/Annexin exclusion (n = 10/cohort) (*p < 0.01 and **p < 0.05). (D) Cell-cycle analysis of post-treatment tumor samples (n = 3/cohort). (E) Fold change in live AKTT and AKTT;4EBP1M tumor cells after 24 hr treatment with PP242 (2.5 μM) ex vivo (n = 3) (*p < 0.001; n.s., no statistical significance). Data are presented as the average ± SEM.
Similar articles
- Inhibition of mammalian target of rapamycin induces phosphatidylinositol 3-kinase-dependent and Mnk-mediated eukaryotic translation initiation factor 4E phosphorylation.
Wang X, Yue P, Chan CB, Ye K, Ueda T, Watanabe-Fukunaga R, Fukunaga R, Fu H, Khuri FR, Sun SY. Wang X, et al. Mol Cell Biol. 2007 Nov;27(21):7405-13. doi: 10.1128/MCB.00760-07. Epub 2007 Aug 27. Mol Cell Biol. 2007. PMID: 17724079 Free PMC article. - Raptor-rictor axis in TGFbeta-induced protein synthesis.
Das F, Ghosh-Choudhury N, Mahimainathan L, Venkatesan B, Feliers D, Riley DJ, Kasinath BS, Choudhury GG. Das F, et al. Cell Signal. 2008 Feb;20(2):409-23. doi: 10.1016/j.cellsig.2007.10.027. Epub 2007 Nov 7. Cell Signal. 2008. PMID: 18068336 - Overexpressed eIF4E is functionally active in surgical margins of head and neck cancer patients via activation of the Akt/mammalian target of rapamycin pathway.
Nathan CO, Amirghahari N, Abreo F, Rong X, Caldito G, Jones ML, Zhou H, Smith M, Kimberly D, Glass J. Nathan CO, et al. Clin Cancer Res. 2004 Sep 1;10(17):5820-7. doi: 10.1158/1078-0432.CCR-03-0483. Clin Cancer Res. 2004. PMID: 15355912 - Targeting Mnks for cancer therapy.
Hou J, Lam F, Proud C, Wang S. Hou J, et al. Oncotarget. 2012 Feb;3(2):118-31. doi: 10.18632/oncotarget.453. Oncotarget. 2012. PMID: 22392765 Free PMC article. Review. - MAP kinase-interacting kinases--emerging targets against cancer.
Diab S, Kumarasiri M, Yu M, Teo T, Proud C, Milne R, Wang S. Diab S, et al. Chem Biol. 2014 Apr 24;21(4):441-452. doi: 10.1016/j.chembiol.2014.01.011. Epub 2014 Mar 6. Chem Biol. 2014. PMID: 24613018 Review.
Cited by
- AZD2014 Radiosensitizes Oral Squamous Cell Carcinoma by Inhibiting AKT/mTOR Axis and Inducing G1/G2/M Cell Cycle Arrest.
Yu CC, Huang HB, Hung SK, Liao HF, Lee CC, Lin HY, Li SC, Ho HC, Hung CL, Su YC. Yu CC, et al. PLoS One. 2016 Mar 31;11(3):e0151942. doi: 10.1371/journal.pone.0151942. eCollection 2016. PLoS One. 2016. PMID: 27031247 Free PMC article. - Transient targeting of BIM-dependent adaptive MCL1 preservation enhances tumor response to molecular therapeutics in non-small cell lung cancer.
Shi K, Lu H, Zhang Z, Fu Y, Wu J, Zhou S, Ma P, Ye K, Zhang S, Shi H, Shi W, Cai MC, Zhao X, Yu Z, Tang J, Zhuang G. Shi K, et al. Cell Death Differ. 2023 Jan;30(1):195-207. doi: 10.1038/s41418-022-01064-2. Epub 2022 Sep 28. Cell Death Differ. 2023. PMID: 36171331 Free PMC article. - Regulation of Ribosome Function by RNA Modifications in Hematopoietic Development and Leukemia: It Is Not Only a Matter of m6A.
Fazi F, Fatica A. Fazi F, et al. Int J Mol Sci. 2021 Apr 30;22(9):4755. doi: 10.3390/ijms22094755. Int J Mol Sci. 2021. PMID: 33946178 Free PMC article. Review. - mTOR as a central hub of nutrient signalling and cell growth.
Kim J, Guan KL. Kim J, et al. Nat Cell Biol. 2019 Jan;21(1):63-71. doi: 10.1038/s41556-018-0205-1. Epub 2019 Jan 2. Nat Cell Biol. 2019. PMID: 30602761 Review. - The sphingosine 1-phosphate receptor S1P₂ maintains the homeostasis of germinal center B cells and promotes niche confinement.
Green JA, Suzuki K, Cho B, Willison LD, Palmer D, Allen CD, Schmidt TH, Xu Y, Proia RL, Coughlin SR, Cyster JG. Green JA, et al. Nat Immunol. 2011 Jun 5;12(7):672-80. doi: 10.1038/ni.2047. Nat Immunol. 2011. PMID: 21642988 Free PMC article.
References
- Avdulov S, Li S, Michalek V, Burrichter D, Peterson M, Perlman DM, Manivel JC, Sonenberg N, Yee D, Bitterman PB, Polunovsky VA. Activation of translation complex eIF4F is essential for the genesis and maintenance of the malignant phenotype in human mammary epithelial cells. Cancer Cell. 2004;5:553–563. - PubMed
- Brunn GJ, Hudson CC, Sekulic A, Williams JM, Hosoi H, Houghton PJ, Lawrence JC, Jr, Abraham RT. Phosphorylation of the translational repressor PHAS-I by the mammalian target of rapamycin. Science. 1997;277:99–101. - PubMed
- Buckland J, Pennington DJ, Bruno L, Owen MJ. Co-ordination of the expression of the protein tyrosine kinase p56(lck) with the pre-T cell receptor during thymocyte development. Eur J Immunol. 2000;30:8–18. - PubMed
Publication types
MeSH terms
Substances
LinkOut - more resources
Full Text Sources
Other Literature Sources
Molecular Biology Databases
Miscellaneous


