Flow cytometric analysis of circulating microparticles in plasma - PubMed (original) (raw)
Review
Flow cytometric analysis of circulating microparticles in plasma
Aaron F Orozco et al. Cytometry A. 2010 Jun.
Abstract
Microparticles, which include exosomes, micro-vesicles, apoptotic bodies and apoptotic microparticles, are small (0.05 - 3 mum in diameter), membranous vesicles that can contain DNA, RNA, miRNA, intracellular proteins and express extracellular surface markers from the parental cells. They can be secreted from intracellular multivesicular bodies or released from the surface of blebbing membranes. Circulating microparticles are abundant in the plasma of normal individuals and can be derived from circulating blood cells such as platelets, red blood cells and leukocytes as well as from tissue sources, such as endothelial and placental tissues. Elevated levels of microparticles are associated with various diseases such as thrombosis (platelet microparticles), congestive heart failure (endothelial microparticles), breast cancer patients (leukocyte microparticles) and women with preeclampsia (syncytiotrophoblast microparticles). Although microparticles can be detected by microscopy, enzyme-linked immunoassays and functional assays, flow cytometry is the preferred method because of the ability to quantitate (fluorescent bead- or flow rate-based method) and because of polychromatic capabilities. However, standardization of pre-analytical and analytical modus operandi for isolating, enumerating and fluorescent labeling of microparticles remains a challenge. The primary focus of this article is to review the preliminary steps required to optimally study circulating in vivo microparticles which include: 1) centrifugation speed used, 2) quantitation of microparticles before antibody labeling, 3) levels of fluorescence intensity of antibody-labeled microparticles, 4) polychromatic flow cytometric analysis of microparticle sub-populations and 5) use of polyclonal antibodies designed for Western blotting for flow cytometry. These studies determine a roadmap to develop microparticles as biomarkers for a variety of conditions.
Copyright 2010 International Society for Advancement of Cytometry.
Figures
Figure 1
Light scatter analysis of in vitro and in vivo MPs by flow cytometry. In vitro MPs were centrifuged at 300 × g to remove cells, followed by a second 800 × g centrifugation. The MP supernatants were then diluted in PBS. Frozen plasma samples were thawed and also diluted in PBS. Light scatter properties of in vitro and in vivo plasma MPs were then compared by flow cytometry and displayed as dot plots (x-axis, SS Log; y-axis, FS Lin). A total of 10,000 events were taken. (A) In vitro apoptotic HTR-8SVneo MPs were re-suspended in PBS and shown in Gate a. (B) In vitro apoptotic JEG-3 MPs were re-suspended in PBS and shown in Gate a. (C) Maternal plasma samples were re-suspended in PBS and shown in Gate a. (D) Non-pregnant plasma samples were re-suspended in PBS and shown in Gate a. Dot plots are representative of three independent experiments.
Figure 2
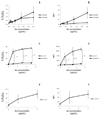
Quantitation of MPs necessary for optimization of Ab labeling. In vitro HTR-8/SVneo MPs were centrifuged at 300 × g to remove cells, followed by a second 800 × g centrifugation. MPs were quantitated by flow cytometry using a fluorescent bead assay described in the MP quantitation for fluorescent staining (in vitro and in vivo) section. For detection of AT1 MPs, supernatants were indirectly labeled with rabbit anti-human AT1 Abs, followed by secondary labeling using PE-conjugated goat anti-rabbit F(ab')2 fragments. A total of 10,000 events were taken. The results are shown as the mean ± standard deviation. (A) The line graph represents the percentage of AT1+ MPs (n = 3). (B) The line graph represents the mean fluorescence intensity (MFI) of AT1 MPs (n = 3).
Figure 3
Amount of plasma MPs varies between individuals. Frozen plasma samples, which underwent a two-step centrifugation (800 × g for 10 minutes, followed by 1,600 × g for additional 10 minutes), were thawed, diluted in PBS and quantitated by flow cytometry using a fluorescent bead assay described in the MP quantitation for fluorescent staining (in vitro and in vivo) section. The results are shown as the mean ± standard deviation. Line graph represents the concentration (number of MPs/µL) of plasma MPs from three individuals (n = 3). A standard curve was generated by plotting the plasma volume (µL; x-axis) versus number of MPs (y-axis).
Figure 4
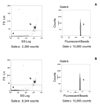
10µm sized beads are easily differentiated from MPs and background “noise”. Frozen plasma samples, which had undergone a two-step centrifugation process (800 × g for 10 minutes and 1,600 × g for 10 minutes) were thawed and the number of MPs was quantitated by flow cytometry using a fluorescent bead count assay. (A) The scattergram shows the events detected in Gate a from samples with PBS + 10µm beads. (B) The scattergram shows the events detected in Gate a from samples with MPs + 10µm beads. The number of beads analyzed is obtained from the corresponding bead histogram Gate c in the PE-fluorescence channel 2. Histograms are representative of three independent experiments.
Figure 5
Polychromatic flow cytometric assay detects subpopulations of trophoblastic MPs. In vitro MPs were centrifuged at 300 × g to remove cells, followed by a second 800 × g centrifugation. Trophoblastic MPs were quantitated using a fluorescent bead assay. MPs were simultaneously labeled with monoclonal Abs against HLA-G (MEM-G/1-unconjugated), PE-conjugated secondary goat anti-mouse IgG, and monoclonal Abs against integrin α5 (CD49e–FITC), integrin αv (CD51-FITC), monocyte marker CD14 (CD14-APC), and platelet marker integrin alpha 2b (CD41-Alexa 647). After Ab labeling, MPs were counter-stained with Hoechst 33342 (dsDNA dye) and analyzed by flow cytometry. (A) Light scatter characteristics of apoptotic MPs. (B) HLA-G+ and DNA+ MPs. (C) CD49e/CD51+ and DNA+ MPs. (D) CD49e/CD51+ and HLA-G+ MPs. (E) CD14+ and DNA+ MPs. (F) CD41+ and DNA+ MPs. Dot plots are representative of three independent experiments.
Figure 6
Abs used for Western blot analysis can be used for flow cytometry. After cell fixation/permeabilization, 0.5 × 10⁶ HTR-8/SVneo cells were indirectly labeled with rabbit anti-human AT1 Abs (sc-1171), followed by secondary labeling using PE-conjugated goat anti-rabbit F(ab')2 fragments or indirectly labeled with mouse anti-human AT1 Abs (LS-C20633), followed by secondary labeling using PE-conjugated goat anti-mouse Abs and analyzed by flow cytometry. The results are shown as the mean ± standard deviation. (A) The line graph represents the percentage of AT1+ HTR-8/SVneo cells (n = 3). (B) The line graph represents the mean fluorescence intensity (MFI) of AT1 HTR-8/SVneo cells (n = 3). (*) indicates significant difference (P < 0.05) compared to LS-C20633.
Figure 7
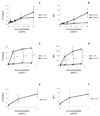
Labeling of HTR-8/SVneo and plasma MPs with anti- AT1 Abs. MPs were quantitated by flow cytometry using a fluorescent bead assay described in the MP quantitation for fluorescent staining (in vitro and in vivo) section. (A–B) Half a million HTR-8/SVneo MPs were directly labeled with PE-conjugated secondary goat anti-rabbit (GAR) F(ab')2 fragments only or directly labeled with PE-conjugated secondary goat anti-mouse (GAM) Abs only. The results are shown as the mean ± standard deviation. (A) The line graph represents the percentage of PE positive MPs (n = 3). (B) The line graph represents the mean fluorescence intensity (MFI) of PE positive MPs (n = 3). (C–D) Half a million HTR-8/SVneo MPs were indirectly labeled with rabbit anti-human AT1 Abs (sc-1173), followed by secondary labeling using PE-conjugated GAR F(ab')2 fragments or indirectly labeled with mouse anti-human AT1 Abs (LS-c20633), followed by secondary labeling using PE-conjugated GAM Abs and analyzed by flow cytometry. The results are shown as the mean ± standard deviation. (C) The line graph represents the percentage of AT1+ MPs labeled with sc-1173 or LS-c20633 Abs (n = 3). (D) The line graph represents the mean fluorescence intensity (MFI) of AT1 MPs (n = 3). (*) indicates significant difference (P < 0.05) compared to LS-C20633. (E–F) Frozen plasma samples were thawed and quantitated using the fluorescence bead-based method. One million plasma MPs were indirectly labeled with rabbit anti-human AT1 Abs (sc-1173), followed by secondary labeling using PE-conjugated GAR F(ab')2 fragments and analyzed by flow cytometry. The results are shown as the mean ± standard deviation. (E) The line graph represents the percentage of AT1+ plasma MPs (n = 3). (F) The line graph represents the mean fluorescence intensity (MFI) of AT1 plasma MPs (n = 3).
Similar articles
- Detection and measurement of microparticles: an evolving research tool for vascular biology.
Enjeti AK, Lincz LF, Seldon M. Enjeti AK, et al. Semin Thromb Hemost. 2007 Nov;33(8):771-9. doi: 10.1055/s-2007-1000369. Semin Thromb Hemost. 2007. PMID: 18175282 Review. - Improved circulating microparticle analysis in acid-citrate dextrose (ACD) anticoagulant tube.
György B, Pálóczi K, Kovács A, Barabás E, Bekő G, Várnai K, Pállinger É, Szabó-Taylor K, Szabó TG, Kiss AA, Falus A, Buzás EI. György B, et al. Thromb Res. 2014 Feb;133(2):285-92. doi: 10.1016/j.thromres.2013.11.010. Epub 2013 Nov 25. Thromb Res. 2014. PMID: 24360116 - Flow cytometric detection and procoagulant activity of circulating canine platelet-derived microparticles.
Helmond SE, Catalfamo JL, Brooks MB. Helmond SE, et al. Am J Vet Res. 2013 Feb;74(2):207-15. doi: 10.2460/ajvr.74.2.207. Am J Vet Res. 2013. PMID: 23363344 - Flow cytometric analysis of cell membrane microparticles.
Gelderman MP, Simak J. Gelderman MP, et al. Methods Mol Biol. 2008;484:79-93. doi: 10.1007/978-1-59745-398-1_6. Methods Mol Biol. 2008. PMID: 18592174 - Overcoming limitations of microparticle measurement by flow cytometry.
Lacroix R, Robert S, Poncelet P, Dignat-George F. Lacroix R, et al. Semin Thromb Hemost. 2010 Nov;36(8):807-18. doi: 10.1055/s-0030-1267034. Epub 2010 Nov 3. Semin Thromb Hemost. 2010. PMID: 21049381 Review.
Cited by
- Non-Coding RNAs: Functional Aspects and Diagnostic Utility in Oncology.
Kim T, Reitmair A. Kim T, et al. Int J Mol Sci. 2013 Mar 1;14(3):4934-68. doi: 10.3390/ijms14034934. Int J Mol Sci. 2013. PMID: 23455466 Free PMC article. - Isolation and Detection Technologies of Extracellular Vesicles and Application on Cancer Diagnostic.
Ma C, Jiang F, Ma Y, Wang J, Li H, Zhang J. Ma C, et al. Dose Response. 2019 Dec 9;17(4):1559325819891004. doi: 10.1177/1559325819891004. eCollection 2019 Oct-Dec. Dose Response. 2019. PMID: 31839757 Free PMC article. Review. - Changes in Exosomal miRNA Composition in Thyroid Cancer Cells after Prolonged Exposure to Real Microgravity in Space.
Wise PM, Neviani P, Riwaldt S, Corydon TJ, Wehland M, Braun M, Krüger M, Infanger M, Grimm D. Wise PM, et al. Int J Mol Sci. 2021 Nov 27;22(23):12841. doi: 10.3390/ijms222312841. Int J Mol Sci. 2021. PMID: 34884646 Free PMC article. - Syncytiotrophoblast vesicles show altered micro-RNA and haemoglobin content after ex-vivo perfusion of placentas with haemoglobin to mimic preeclampsia.
Cronqvist T, Saljé K, Familari M, Guller S, Schneider H, Gardiner C, Sargent IL, Redman CW, Mörgelin M, Åkerström B, Gram M, Hansson SR. Cronqvist T, et al. PLoS One. 2014 Feb 27;9(2):e90020. doi: 10.1371/journal.pone.0090020. eCollection 2014. PLoS One. 2014. PMID: 24587192 Free PMC article. - Microparticles as a source of extracellular DNA.
Pisetsky DS, Gauley J, Ullal AJ. Pisetsky DS, et al. Immunol Res. 2011 Apr;49(1-3):227-34. doi: 10.1007/s12026-010-8184-8. Immunol Res. 2011. PMID: 21132466 Free PMC article.
References
- Thery C, Ostrowski M, Segura E. Membrane vesicles as conveyors of immune responses. Nat Rev Immunol. 2009;9:581–593. - PubMed
- Valadi H, Ekstrom K, Bossios A, Sjostrand M, Lee JJ, Lotvall JO. Exosome-mediated transfer of mRNAs and microRNAs is a novel mechanism of genetic exchange between cells. Nat Cell Biol. 2007;9:654–659. - PubMed
- Luo SS, Ishibashi O, Ishikawa G, Ishikawa T, Katayama A, Mishima T, Takizawa T, Shigihara T, Goto T, Izumi A. Human Villous Trophoblasts Express and Secrete Placenta-Specific MicroRNAs into Maternal Circulation via Exosomes. Biol Reprod. 2009 and others. - PubMed
- Thery C, Boussac M, Veron P, Ricciardi-Castagnoli P, Raposo G, Garin J, Amigorena S. Proteomic analysis of dendritic cell-derived exosomes: a secreted subcellular compartment distinct from apoptotic vesicles. J Immunol. 2001;166:7309–7318. - PubMed
- Arteaga RB, Chirinos JA, Soriano AO, Jy W, Horstman L, Jimenez JJ, Mendez A, Ferreira A, de Marchena E, Ahn YS. Endothelial microparticles and platelet and leukocyte activation in patients with the metabolic syndrome. Am J Cardiol. 2006;98:70–74. - PubMed
Publication types
MeSH terms
Grants and funding
- T32 AI007495/AI/NIAID NIH HHS/United States
- HDO46623/PHS HHS/United States
- P30 AI036211/AI/NIAID NIH HHS/United States
- T32AI007495/AI/NIAID NIH HHS/United States
- R01 HD046623/HD/NICHD NIH HHS/United States
- R01 HD046623-03/HD/NICHD NIH HHS/United States
LinkOut - more resources
Full Text Sources
Other Literature Sources


