Loss of HRD1-mediated protein degradation causes amyloid precursor protein accumulation and amyloid-beta generation - PubMed (original) (raw)
Comparative Study
Loss of HRD1-mediated protein degradation causes amyloid precursor protein accumulation and amyloid-beta generation
Masayuki Kaneko et al. J Neurosci. 2010.
Abstract
Endoplasmic reticulum-associated degradation (ERAD) is a system by which proteins accumulated in the endoplasmic reticulum (ER) are retrotranslocated to the cytosol and degraded by the ubiquitin-proteasome pathway. HRD1 is expressed in brain neurons and acts as an ERAD ubiquitin ligase. Amyloid precursor protein (APP) is processed into amyloid-beta peptides (Abetas) that form plaque deposits in the brains of Alzheimer's disease (AD) patients. We found significantly decreased HRD1 protein levels in the cerebral cortex of AD patients. HRD1 colocalized with APP in brain neurons and interacted with APP through the proline-rich region of HRD1. HRD1 promoted APP ubiquitination and degradation, resulting in decreased generation of Abeta. Furthermore, suppression of HRD1 expression induced APP accumulation that led to increased production of Abeta associated with ER stress. Immunohistochemical analysis revealed that suppression of HRD1 expression inhibited APP aggresome formation, resulting in apoptosis. In addition, we found that the ATF6- and XBP1-induced upregulation of ERAD led to APP degradation and reduced Abeta production. These results suggest that the breakdown of HRD1-mediated ERAD causes Abeta generation and ER stress, possibly linked to AD.
Figures
Figure 1.
Protein and mRNA levels of HRD1 in the AD brain. a, Protein levels of HRD1, SEL1, PDI, and β-actin in the AD brains. The cerebral cortex of AD patients and non-AD controls were subjected to Western blotting. b, Statistical analysis of a. Data are normalized to the amount of β-actin; results are expressed as a box plot (control, n = 8; AD, n = 6). Asterisk represents a significant difference (Student's t test, *p < 0.05). c, mRNA levels of HRD1and ER stress-responsive genes in the AD brain. The mRNA expression levels in the brains were quantified by real-time PCR. Data are normalized to the amount of β-actin. Results are expressed as a box plot (Student's t test; *p < 0.05, **p < 0.01).
Figure 2.
Colocalization of HRD1 and APP in the brain and neuronal cells. a, Colocalization of HRD1 and APP in the murine hippocampus and cerebral cortex. The coronal sections of the murine hippocampus (top and middle) and cerebral cortex (bottom) were subjected to immunofluorescence staining with HRD1 (Abgent), APP (6E10), and NeuN antibodies. DG, dentate gyrus; Cortex, cerebral cortex. Scale bars, 200 μm. b, Colocalization of HRD1 and APP in the ER. SH-SY5Y cells were subjected to immunofluorescence staining with HRD1 (Otsuka), APP (C-terminal), and PDI antibodies. Scale bars, 20 μm.
Figure 3.
Interaction of HRD1 with APP. a, Interaction of overexpressed APP and HRD1 in HEK293 cells. Coimmunoprecipitation of HRD1 and APP was performed in HEK293 cells transiently transfected with APP-FLAG and HRD1-myc. The cell lysates were immunoprecipitated with anti-FLAG antibody or normal mouse IgG. The immune complexes were analyzed by Western blotting with anti-myc or anti-FLAG antibodies. b, Interaction of endogenous HRD1 and APP in SH-SY5Y cells. SH-SY5Y cells were treated with 5 μg/ml Tm for 12 h. The cells were incubated with 2 m
m
dithiobis(succinimidylpropionate) for 2 h, followed by 20 m
m
Tris-HCl, pH 7.6, for 15 min. Cell lysates were immunoprecipitated with anti-APP (C-terminal) antibody. Immune complexes were analyzed by Western blotting using anti-HRD1 (Sigma) and APP (C-terminal) antibodies. c, Schematic diagrams of HRD1 deletion mutants. The panel graphically represents wt-HRD1 and a variety of HRD1 mutants. d, Interaction of APP with HRD1 and its mutants. Coimmunoprecipitation of APP and HRD1 mutants was performed in HEK293 cells transiently transfected with APP-FLAG and either an empty vector (mock), wt-, M-, ΔM-, or MR-HRD1-myc. The cell lysates were immunoprecipitated with anti-FLAG antibody, and then analyzed by Western blotting using anti-myc antibody.
Figure 4.
Ubiquitination and degradation of APP by HRD1. a, In vitro ubiquitination assay. The reaction products, containing APP protein produced by a transcription/translation system, were mixed in the reaction buffer with E1 (rabbit), E2 (GST-UbcH5c), E3 (GST-RP-HRD1), and GST-ubiquitin. The reaction mixture was immunoprecipitated with anti-FLAG antibody and analyzed by Western blotting using anti-GST antibody. b, Degradation of APP by HRD1. Normal HEK293 cells and those stably expressing wt-HRD1, two stable cell lines (3 and 4), or M-HRD1 were transiently transfected with APP-FLAG and incubated for the indicated periods in the presence or absence of 10 μ
m
MG132 for 12 h. The total cell lysates were analyzed by Western blotting with anti-FLAG (first panel), anti-myc (second panel), anti-α-tubulin (third panel) antibodies. c, d, Aβ levels were measured by a sandwich ELISA in b. HEK293 cells and those expressing wt- and M-HRD1 were transiently transfected with APP-FLAG. Data (pg/ml Aβ peptide) are normalized to the amount of APP mRNA quantified by real-time PCR. Results are expressed as a fold increase compared with normal cells (mean ± SEM; n = 3). Statistical analysis was performed with ANOVA followed by Bonferroni correction (M-HRD1 vs wt-HRD1; **p < 0.01).
Figure 5.
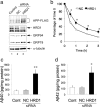
APP accumulation and Aβ generation by suppression of HRD1 expression. a, Induction of APP accumulation by HRD1 siRNA. SH-SY5Y cells stably expressing APP-FLAG were transiently transfected with NC or HRD1 siRNA. The total cell lysates were analyzed by Western blotting with the indicated antibodies. GRP78 and GRP94 were detected with anti-KDEL antibody. b, CHX assay. SH-SY5Y cells stably expressing APP-FLAG were transfected with NC or HRD1 siRNA. At 48 h after transfection, the cells were treated with 20 μg/ml CHX for the indicated periods. Total cell lysates were analyzed by Western blotting using anti-FLAG M2 antibody. Levels of APP at each time point were plotted relative to the amount present at time 0 (mean ± SEM; n = 5). Asterisk represents a significant difference (Student's t test, *p < 0.05). c, d, Aβ levels were measured by a sandwich ELISA using the culture medium of a. Results are expressed as a ratio of the total amount of Aβ peptides (pg) to the total amount of protein from whole-cell extracts (mg) (mean ± SEM; n = 4). Statistical analysis was performed with ANOVA followed by Bonferroni correction (control and NC vs HRD1; *p < 0.05, **p < 0.01).
Figure 6.
Inhibition of APP aggresome formation by suppression of HRD1 expression. a, SH-SY5Y cells stably expressing APP-FLAG were transiently transfected with NC (top) or HRD1 (bottom) siRNA. The cells were subjected to immunofluorescence staining with anti-FLAG (green) and anti-cleaved caspase-3 (red) antibodies. Scale bars, 100 μm. b, Statistical analysis of Figure 6_a_. The percentage of apoptotic cells was counted in three different areas. The results are expressed as mean ± SEM (n = 3). Statistical analysis was performed with ANOVA followed by Bonferroni correction (*p < 0.05, **p < 0.01). c, Localization of APP and γ-tubulin protein. d, Localization of HRD1 and γ-tubulin. SH-SY5Y cells were treated with 5 μ
m
MG132 for 12 h and then subjected to immunofluorescence staining using APP (C-terminal), HRD1 (Otsuka), and γ-tubulin antibodies. Scale bars, 20 μm.
Figure 7.
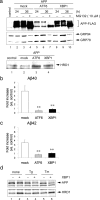
Degradation of APP by UPR activation. a, Degradation of overexpressed APP protein by ATF6 and XBP1. HEK293 cells were transiently transfected with APP-FLAG and an empty vector (mock), HA-ATF6, or HA-XBP1 for the indicated periods. The total cell lysates were analyzed by Western blotting using FLAG, KDEL and HRD1 (Otsuka) antibodies. b, c, Aβ levels were measured by sandwich ELISA using the culture medium of a at 36 h. Data (pg/ml Aβ peptide) are normalized to the amount of APP mRNA quantified by real-time PCR. Results are expressed as a fold increase compared with normal cells (mean ± SEM; n = 4). Statistical analysis was performed with ANOVA followed by Bonferroni correction (control vs mock, ATF6, and XBP1; **p < 0.01). d, Degradation of endogenous APP protein by XBP1 under ER stress conditions. XBP1 were induced using a tetracycline-inducible expression system (Tet-on) in HEK293 cells. The cells were treated with 1 μ
m
Tg and 5 μg/ml Tm for 12 h. Total cell lysates were analyzed by Western blotting using APP (C-terminal) and HRD1 (Sigma) antibodies.
Similar articles
- [Physiological Roles of Ubiquitin Ligases Related to the Endoplasmic Reticulum].
Kaneko M. Kaneko M. Yakugaku Zasshi. 2016;136(6):805-9. doi: 10.1248/yakushi.15-00292-2. Yakugaku Zasshi. 2016. PMID: 27252059 Review. Japanese. - [Molecular pharmacological studies on the protection mechanism against endoplasmic reticulum stress-induced neurodegenerative disease].
Kaneko M. Kaneko M. Yakugaku Zasshi. 2012;132(12):1437-42. doi: 10.1248/yakushi.12-00249. Yakugaku Zasshi. 2012. PMID: 23208051 Review. Japanese. - Correlation between decrease in protein levels of ubiquitin ligase HRD1 and amyloid-beta production.
Saito R, Kaneko M, Okuma Y, Nomura Y. Saito R, et al. J Pharmacol Sci. 2010;113(3):285-8. doi: 10.1254/jphs.10118sc. Epub 2010 Jul 1. J Pharmacol Sci. 2010. PMID: 20606367 - Possible involvement of ubiquitin ligase HRD1 insolubilization in amyloid β generation.
Kaneko M, Saito R, Okuma Y, Nomura Y. Kaneko M, et al. Biol Pharm Bull. 2012;35(2):269-72. doi: 10.1248/bpb.35.269. Biol Pharm Bull. 2012. PMID: 22293361
Cited by
- The Cryo-EM Effect: Structural Biology of Neurodegenerative Disease Proteostasis Factors.
Creekmore BC, Chang YW, Lee EB. Creekmore BC, et al. J Neuropathol Exp Neurol. 2021 Jun 4;80(6):494-513. doi: 10.1093/jnen/nlab029. J Neuropathol Exp Neurol. 2021. PMID: 33860329 Free PMC article. Review. - Activation of OASIS family, ER stress transducers, is dependent on its stabilization.
Kondo S, Hino SI, Saito A, Kanemoto S, Kawasaki N, Asada R, Izumi S, Iwamoto H, Oki M, Miyagi H, Kaneko M, Nomura Y, Urano F, Imaizumi K. Kondo S, et al. Cell Death Differ. 2012 Dec;19(12):1939-49. doi: 10.1038/cdd.2012.77. Epub 2012 Jun 15. Cell Death Differ. 2012. PMID: 22705851 Free PMC article. - Alpha-Secretase ADAM10 Regulation: Insights into Alzheimer's Disease Treatment.
Peron R, Vatanabe IP, Manzine PR, Camins A, Cominetti MR. Peron R, et al. Pharmaceuticals (Basel). 2018 Jan 29;11(1):12. doi: 10.3390/ph11010012. Pharmaceuticals (Basel). 2018. PMID: 29382156 Free PMC article. Review. - mSEL-1L (Suppressor/enhancer Lin12-like) protein levels influence murine neural stem cell self-renewal and lineage commitment.
Cardano M, Diaferia GR, Cattaneo M, Dessì SS, Long Q, Conti L, Deblasio P, Cattaneo E, Biunno I. Cardano M, et al. J Biol Chem. 2011 May 27;286(21):18708-19. doi: 10.1074/jbc.M110.210740. Epub 2011 Mar 31. J Biol Chem. 2011. PMID: 21454627 Free PMC article. - Ubiquitin pathways in neurodegenerative disease.
Atkin G, Paulson H. Atkin G, et al. Front Mol Neurosci. 2014 Jul 8;7:63. doi: 10.3389/fnmol.2014.00063. eCollection 2014. Front Mol Neurosci. 2014. PMID: 25071440 Free PMC article. Review.
References
- Amano T, Yamasaki S, Yagishita N, Tsuchimochi K, Shin H, Kawahara K, Aratani S, Fujita H, Zhang L, Ikeda R, Fujii R, Miura N, Komiya S, Nishioka K, Maruyama I, Fukamizu A, Nakajima T. Synoviolin/Hrd1, an E3 ubiquitin ligase, as a novel pathogenic factor for arthropathy. Genes Dev. 2003;17:2436–2449. - PMC - PubMed
- Apodaca J, Kim I, Rao H. Cellular tolerance of prion protein PrP in yeast involves proteolysis and the unfolded protein response. Biochem Biophys Res Commun. 2006;347:319–326. - PubMed
- Bunnell WL, Pham HV, Glabe CG. gamma-secretase cleavage is distinct from endoplasmic reticulum degradation of the transmembrane domain of the amyloid precursor protein. J Biol Chem. 1998;273:31947–31955. - PubMed
- Carvalho P, Goder V, Rapoport TA. Distinct ubiquitin-ligase complexes define convergent pathways for the degradation of ER proteins. Cell. 2006;126:361–373. - PubMed
Publication types
MeSH terms
Substances
LinkOut - more resources
Full Text Sources
Other Literature Sources
Miscellaneous


