Calmodulin controls synaptic strength via presynaptic activation of calmodulin kinase II - PubMed (original) (raw)
Comparative Study
Calmodulin controls synaptic strength via presynaptic activation of calmodulin kinase II
Zhiping P Pang et al. J Neurosci. 2010.
Abstract
Calmodulin regulates multifarious cellular processes via a panoply of target interactions. However, the central role, multiple isoforms, and complex target interactions of calmodulin make it difficult to examine its precise functions. Here, we analyzed calmodulin function in neurons using lentivirally delivered short-hairpin RNAs that suppressed expression of all calmodulin isoforms by approximately 70%. Calmodulin knockdown did not significantly alter neuronal survival or synapse formation but depressed spontaneous neuronal network activity. Strikingly, calmodulin knockdown decreased the presynaptic release probability almost twofold, without altering the presynaptic readily-releasable vesicle pool or postsynaptic neurotransmitter reception. In calmodulin knockdown neurons, presynaptic release was restored to wild-type levels by expression of constitutively active calmodulin-dependent kinase-IIalpha (CaMKIIalpha); in contrast, in control neurons, expression of constitutively active CaMKIIalpha had no effect on presynaptic release. Viewed together, these data suggest that calmodulin performs a major function in boosting synaptic strength via direct activation of presynaptic calmodulin-dependent kinase II.
Figures
Figure 1.
shRNA-dependent knockdown of CaM. A, Diagram of lentiviral vectors harboring the human H1 and U6 RNA-polymerase III promoters, which drive expression of shRNAs for KD of CaM1 and CaM2 (H1) and CaM3 (U6). The vector also contains a RNA-polymerase II ubiquitin promoter (Ub) that drives expression of EGFP (to visualize infected neurons, via an IRES sequence) without or with rescue cDNAs (e.g., CaM1 without or with Ca2+-binding mutations, in an shRNA-resistant form). For single polymerase III promoter vectors, see supplemental Figure 2 (available at
as supplemental material). B, Analysis of CaM KD efficiency using qRT-PCR of mRNAs encoding CaM1, CaM2, and CaM3. Cultured cortical neurons were infected with control or CaM KD vectors on DIV5 and analyzed on DIV14 (means ± SEMs; numbers in bars indicate number of experiments; statistical significance was calculated by Student's t test, ***p < 0.001). C, Analysis of CaM KD efficiency using immunoblotting. Synt1, Syntaxin-1; Syt1, synaptotagmin-1; VCP, vasolin-containing protein.
Figure 2.
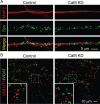
CaM KD does not alter synapse density in cultured neurons. A, Representative images of neurons infected with control or CaM KD lentiviruses and immunolabeled with antibodies to MAP2 and synapsin (Syn). Synapse density was quantified by counting the number of synapsin-stained puncta per dendrite area identified by MAP2 staining using NIH ImageJ. In control condition, the average density of synapses is 5.73 ± 0.27/μm2 dendritic area; in the CaM KD condition, the average synaptic density is 5.73 ± 0.22/μm2 (n = 51 and 52 in control and CaM KD, respectively). Three batches of cultures were analyzed. B, Representative images of excitatory and inhibitory synapses in cultured neurons infected with control lentivirus or the CaM KD lentivirus. Synapses were immunolabeled with antibodies to the vesicular glutamate transporter (specific for excitatory synapses; VGLUT1) and to the vesicular GABA transporter (specific for inhibitory synapses; VGAT). Insets show magnified images from the areas indicated by dashed squares. There is no difference in the number of either VGAT or VGLUT1 puncta between control and CaM KD (supplemental Fig. 3, available at
as supplemental material). The ratios of VGLUT1/VGAT puncta are 1.01 ± 0.06 and 0.99 ± 0.06 in control (n = 41) and CaM KD (n = 43). Four different batches of cultured neurons were analyzed.
Figure 3.
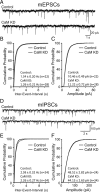
CaM KD does not alter spontaneous synaptic “mini” release in cultured neurons. A, Representative traces of mEPSCs in control and CaM KD synapses. B, Cumulative probability of the distribution of the mEPSC frequency. The average frequency of mEPSCs in control is 1.34 ± 0.20 Hz (n = 22) and in CaM KD is 1.26 ± 0.21 Hz (n = 28). C, Cumulative probability of the distribution of the mEPSC amplitudes. The average amplitudes of mEPSCs are 10.46 ± 0.49 (n = 22) and 11.22 ± 0.72 (n = 28) in control and CaM KD, respectively. D, Representative traces of mIPSCs in control and CaM KD synapses. E, Cumulative probability of the distribution of the mIPSC frequency. The average frequencies of mEPSCs in control and CaM KD are 2.58 ± 0.32 Hz (n = 24) and 2.26 ± 0.27 Hz (n = 34), respectively. F, Cumulative probability of the distribution of the mIPSC amplitudes. The average amplitudes of mIPSCs are 48.52 ± 2.82 (n = 24) and 44.13 ± 2.63 (n = 34) in control and CaM KD, respectively. Data presented are means ± SEMs; statistical significance was calculated by Student's t test and Kolmogorov–Smirnov test.
Figure 4.
CaM KD suppresses network activity in cultured neurons. A, Representative electrophysiological traces of excitatory network activity in high-density cultures of cortical neurons, infected with control lentivirus or lentivirus expressing the CaM shRNAs without (CaM KD) or with the wild-type CaM proteins (CaM KD + WT CaM). B, Quantitation of four parameters of the excitatory network activity as a function of the CaM KD: burst frequency (far left), burst duration (middle left), synaptic charge transfer during bursts (middle right), and charge transfer rate (far right). Data are means ± SEMs; numbers in bars indicate number of cells analyzed in at least three independent experiments. Statistical significance was calculated by Student's t test, *p < 0.05, **p < 0.01, ***p < 0.001.
Figure 5.
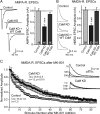
CaM KD decreases the strength and release probability of excitatory synapses. A, Representative traces (left) and summary graphs of the amplitudes (right) of evoked AMPA-receptor-mediated EPSCs in neurons infected with lentiviruses that express only EGFP (Control), coexpress EGFP with the CaM KD shRNAs (CaM KD), or with CaM shRNAs and wild-type CaM (CaM KD + WT CaM). B, Same as A but for NMDA-receptor-mediated evoked responses. C, Summary graph of relative NMDA-receptor-mediated EPSC amplitudes as a function of stimulus number in the presence of MK-801; representative traces are shown in the inset. Measurements of the presynaptic release probability using progressive blockade of NMDA-receptor-mediated EPSCs with the irreversible open-channel inhibitor MK-801. The decay constant, express as the Tau value of the decay in stimulus numbers, is inversely proportional to release probability (Hessler et al., 1993; Rosenmund et al., 1993). Data are means ± SEMs; numbers in bars indicate number of cells analyzed in at least three independent experiments. Statistical significance was calculated by Student's t test, ***p < 0.001.
Figure 6.
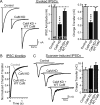
Inhibitory synaptic strength is reduced in CaM KD synapses. A, Representative traces (left), and summary graphs of the amplitudes (middle), and charge transfer (right) of evoked IPSCs in neurons infected with lentiviruses that express only EGFP (Control), coexpress EGFP with the CaM KD shRNAs (CaM KD), or with CaM shRNAs and wild-type CaM (CaM KD + WT CaM). B, Kinetics of the IPSCs as a function of CaM KD, calculated as the cumulative normalized charge transfer (Maximov and Südhof, 2005). C, Representative traces (left) and summary graphs of the charge transfer (right) of IPSCs induced by hypertonic sucrose (0.5
m
for 30 s) in neurons infected with lentiviruses that express only EGFP (Control), coexpress EGFP with the CaM KD shRNAs (CaM KD), or with CaM shRNAs and wild-type CaM (CaM KD + WT rescue). Data are means ± SEMs; numbers in bars indicate number of cells analyzed in at least three independent experiments. Statistical significance was calculated by Student's t test, ***p < 0.001.
Figure 7.
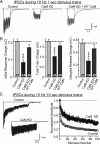
Effect of CaM KD on synaptic transmission during 10 Hz stimulus trains. A, Representative traces of synaptic responses induced by a 10 Hz, 1 s stimulus train in neurons infected with lentiviruses that express only EGFP (Control), coexpress EGFP with the CaM KD shRNAs (CaM KD), or with CaM shRNAs and wild-type CaM (CaM KD + WT CaM). B, Quantitation of the effect of CaM KDs on the synaptic charge transfer during the initial response of the 10 Hz stimulus train (left), total train (middle), and delayed release (right). C, Representative traces of IPSCs during 10 s, 10 Hz stimulus trains (left) and normalized responses to quantify the degree of depression (right). Note that only the synchronous component of the responses is included in the normalization, which increases the apparent degree of depression. Data are means ± SEMs; numbers in bars in B indicate number of cells analyzed in at least three independent experiments. Statistical significance was calculated by Student's t test, ***p < 0.001. Numbers of recordings presented in C are 27 and 30 for control and CaM KD, respectively. Curves in C are significantly different (p < 0.0001) using two-way ANOVA.
Figure 8.
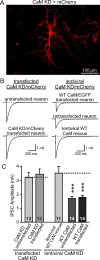
No postsynaptic contribution observed after CaM KD in reduction of synaptic strength. A, Image of sparsely transfected cultured cortical neurons expressing CaM shRNAs and mCherry. B, Representative traces of evoked IPSCs from cultured cortical neurons testing the effects of a postsynaptic CaM KD. Left traces depict experiments in which neurons were transfected with CaM shRNAs to produce a selective postsynaptic CaM KD in a few neurons in a culture dish, using mCherry as a marker for the transfected neurons. Right traces depict experiments in which all neurons were subjected to lentiviral CaM KD without or with lentivirally mediated WT CaM rescue, using mCherry as a marker for the infected neurons. Subsequently, the lentivirally mediated CaM KD neurons were transfected with shRNA-resistant WT CaM, such that only a few neurons were transfected that were identified by coexpressed EGFP. For all experiments, lentiviral infections were performed at DIV5, transfections at DIV9, and electrophysiological analyses at DIV14. Note that the two experimental designs are complementary, because the design depicted in the left traces measures the effect of a selective postsynaptic CaM KD, whereas the design depicted in the right traces measures the effect of a postsynaptic CaM rescue in CaM KD neurons. C, Summary graphs of evoked IPSC amplitudes in neurons that were manipulated as described in B. Data show means ± SEMs from three independent experiments; numbers in bars indicate number of cells analyzed. Statistical significance was calculated by Student's t test, ***p < 0.001.
Figure 9.
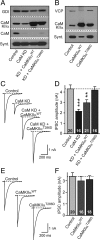
CaMKIIa overexpression rescues synaptic strength in CaM KD synapses. A, Neurons were infected with lentivirus expressing only EGFP (Control); coexpressing EGFP with CaM KD shRNAs (CaM KD); coexpressing EGFP, CaM KD shRNAs, and wild-type CaM Kinase IIα (KD + CaMKIIαWT), and coexpressing EGFP, CaM KD shRNAs, and the T286D constitutively active mutant of CaMKIIα (KD + CaMKIIαT286D). Representative immunoblots of CaMKIIα, CaM, syntaxin (Synt), and GDI (GDP-dissociation inhibitor) were used as loading control. B, Immunoblots of cultures (without CaM KD shRNAs) expressing EGFP (Control); coexpressing EGFP with CaMKIIαWT (CaMKIIαWT); and coexpressing of EGFP with CaMKIIαT286D (CaMKIIαT286D). VCP (vasolin-containing protein) was used as loading control. C, Representative traces of evoked IPSCs in CaM KD cultures with manipulations described in A. D, Summary graphs of the mean IPSC amplitudes in neurons that were manipulated as described in A. E, Representative traces of evoked IPSCs in control cultures with or without CaMKIIαWT or CaMKIIαT286D (i.e., the effect of CaMKIIα overexpression on neurons expressing normal CaM levels was investigated). F, Summary graphs of the mean IPSC amplitudes in neurons that were manipulated as described in E. Data are means ± SEM; numbers in bars indicate number of cells analyzed in at least three independent experiments; statistical significance was calculated by Student's t test. **p < 0.01, ***p < 0.001.
Similar articles
- Changes in the distribution of calcium calmodulin-dependent protein kinase II at the presynaptic bouton after depolarization.
Tao-Cheng JH, Dosemeci A, Winters CA, Reese TS. Tao-Cheng JH, et al. Brain Cell Biol. 2006 Jun;35(2-3):117-24. doi: 10.1007/s11068-007-9012-5. Epub 2007 Sep 20. Brain Cell Biol. 2006. PMID: 17957478 - Subunit-specific and homeostatic regulation of glutamate receptor localization by CaMKII in Drosophila neuromuscular junctions.
Morimoto T, Nobechi M, Komatsu A, Miyakawa H, Nose A. Morimoto T, et al. Neuroscience. 2010 Feb 17;165(4):1284-92. doi: 10.1016/j.neuroscience.2009.11.059. Epub 2009 Dec 1. Neuroscience. 2010. PMID: 19961909 - Differential control of presynaptic CaMKII activation and translocation to active zones.
Shakiryanova D, Morimoto T, Zhou C, Chouhan AK, Sigrist SJ, Nose A, Macleod GT, Deitcher DL, Levitan ES. Shakiryanova D, et al. J Neurosci. 2011 Jun 22;31(25):9093-100. doi: 10.1523/JNEUROSCI.0550-11.2011. J Neurosci. 2011. PMID: 21697360 Free PMC article. - Stimulation-induced changes in diffusion and structure of calmodulin and calmodulin-dependent protein kinase II proteins in neurons.
Heidarinejad M, Nakamura H, Inoue T. Heidarinejad M, et al. Neurosci Res. 2018 Nov;136:13-32. doi: 10.1016/j.neures.2018.01.003. Epub 2018 Feb 1. Neurosci Res. 2018. PMID: 29395358 Review.
Cited by
- Synaptic Function of Rab11Fip5: Selective Requirement for Hippocampal Long-Term Depression.
Bacaj T, Ahmad M, Jurado S, Malenka RC, Südhof TC. Bacaj T, et al. J Neurosci. 2015 May 13;35(19):7460-74. doi: 10.1523/JNEUROSCI.1581-14.2015. J Neurosci. 2015. PMID: 25972173 Free PMC article. - Membrane-tethered monomeric neurexin LNS-domain triggers synapse formation.
Gokce O, Südhof TC. Gokce O, et al. J Neurosci. 2013 Sep 4;33(36):14617-28. doi: 10.1523/JNEUROSCI.1232-13.2013. J Neurosci. 2013. PMID: 24005312 Free PMC article. - Elimination of Calm1 long 3'-UTR mRNA isoform by CRISPR-Cas9 gene editing impairs dorsal root ganglion development and hippocampal neuron activation in mice.
Bae B, Gruner HN, Lynch M, Feng T, So K, Oliver D, Mastick GS, Yan W, Pieraut S, Miura P. Bae B, et al. RNA. 2020 Oct;26(10):1414-1430. doi: 10.1261/rna.076430.120. Epub 2020 Jun 10. RNA. 2020. PMID: 32522888 Free PMC article. - Calmodulin as a major calcium buffer shaping vesicular release and short-term synaptic plasticity: facilitation through buffer dislocation.
Timofeeva Y, Volynski KE. Timofeeva Y, et al. Front Cell Neurosci. 2015 Jul 1;9:239. doi: 10.3389/fncel.2015.00239. eCollection 2015. Front Cell Neurosci. 2015. PMID: 26190970 Free PMC article. - Dynamic binding mode of a Synaptotagmin-1-SNARE complex in solution.
Brewer KD, Bacaj T, Cavalli A, Camilloni C, Swarbrick JD, Liu J, Zhou A, Zhou P, Barlow N, Xu J, Seven AB, Prinslow EA, Voleti R, Häussinger D, Bonvin AM, Tomchick DR, Vendruscolo M, Graham B, Südhof TC, Rizo J. Brewer KD, et al. Nat Struct Mol Biol. 2015 Jul;22(7):555-64. doi: 10.1038/nsmb.3035. Epub 2015 Jun 1. Nat Struct Mol Biol. 2015. PMID: 26030874 Free PMC article.
References
- Benfenati F, Valtorta F, Rubenstein JL, Gorelick FS, Greengard P, Czernik AJ. Synaptic vesicle-associated Ca2+/calmodulin-dependent protein kinase II is a binding protein for synapsin I. Nature. 1992;359:417–420. - PubMed
- Berridge MJ, Lipp P, Bootman MD. The versatility and universality of calcium signalling. Nat Rev Mol Cell Biol. 2000;1:11–21. - PubMed
- Braun AP, Schulman H. The multifunctional calcium/calmodulin-dependent protein kinase: from form to function. Annu Rev Physiol. 1995;57:417–445. - PubMed
- Brickey DA, Bann JG, Fong YL, Perrino L, Brennan RG, Soderling TR. Mutational analysis of the autoinhibitory domain of calmodulin kinase II. J Biol Chem. 1994;269:29047–29054. - PubMed
Publication types
MeSH terms
Substances
LinkOut - more resources
Full Text Sources

