Variation in transcription factor binding among humans - PubMed (original) (raw)
Comparative Study
. 2010 Apr 9;328(5975):232-5.
doi: 10.1126/science.1183621. Epub 2010 Mar 18.
Fabian Grubert, Christopher Heffelfinger, Manoj Hariharan, Akwasi Asabere, Sebastian M Waszak, Lukas Habegger, Joel Rozowsky, Minyi Shi, Alexander E Urban, Mi-Young Hong, Konrad J Karczewski, Wolfgang Huber, Sherman M Weissman, Mark B Gerstein, Jan O Korbel, Michael Snyder
Affiliations
- PMID: 20299548
- PMCID: PMC2938768
- DOI: 10.1126/science.1183621
Comparative Study
Variation in transcription factor binding among humans
Maya Kasowski et al. Science. 2010.
Abstract
Differences in gene expression may play a major role in speciation and phenotypic diversity. We examined genome-wide differences in transcription factor (TF) binding in several humans and a single chimpanzee by using chromatin immunoprecipitation followed by sequencing. The binding sites of RNA polymerase II (PolII) and a key regulator of immune responses, nuclear factor kappaB (p65), were mapped in 10 lymphoblastoid cell lines, and 25 and 7.5% of the respective binding regions were found to differ between individuals. Binding differences were frequently associated with single-nucleotide polymorphisms and genomic structural variants, and these differences were often correlated with differences in gene expression, suggesting functional consequences of binding variation. Furthermore, comparing PolII binding between humans and chimpanzee suggests extensive divergence in TF binding. Our results indicate that many differences in individuals and species occur at the level of TF binding, and they provide insight into the genetic events responsible for these differences.
Figures
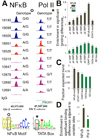
Fig. 1
Effect of SNPs on NFκB and PolII binding. (A) Signal tracks of a NFκB motif and a TATA-box demonstrate effects of B-SNPs on TF binding, with correlations in the expected direction (i.e., with “correct trend”). (B) Fold enrichments for cumulative SNP-differences affecting BRs and for single SNPs affecting motifs, in pair-wise comparisons between individuals relative to the overall frequency of binding differences for NFκB (7.5%) and PolII (25%). (C) B-SNPs affecting motifs frequently lead to binding differences with “correct trend”. *P<0.001, based on randomization tests involving 10,000 permutations, i.e. permutation tests). (D) BRs adjacent to differentially bound BRs are enriched for binding variation.
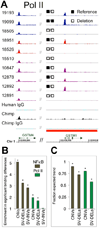
Fig. 2
Effect of SVs on TF binding. (A) Example of a deletion affecting PolII binding. This example also shows a comparison of PolII occupancy in humans and a chimpanzee. A subset of individuals shares the chimpanzee binding phenotype. (B) Effect-sizes for microarray-based CNVs, SV-DELs (deletions identified by paired-end mapping), and SV-INVs (inversions detected by paired-end mapping). (C) Binding differences in regions displaying CNVs and SV-DELs frequently follow the “correct trend” in pair-wise comparisons between individuals. *P<0.01, based on permutation tests.
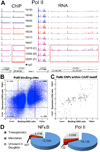
Fig. 3
Correlation and effect sizes of TF binding and gene expression. (A) Example showing a correlation of binding and expression. This figure also shows a transgression event, in which the daughter displays a strong increase in binding relative to the parents. Continuous signal tracks shown in Fig. S10C. (B) Regions with binding variation correlate with differences in expression. Dark blue dots: PolII BRs displaying significant differences in binding in pair-wise comparisons between individuals; light blue dots: other BRs. The black lines demarcate data points that either fall two standard deviations outside the binding ratio or gene expression distributions. Indicated counts represent data points falling into the four corners for each data set. (C) Strong correlation between binding and gene expression at BRs in which a B-SNP intersects with the PolII specific CAAT-box. (D) Breakdown of segregation events in the trio showing the extent of BRs with candidate transgression events.
Fig. 4
Comparison of PolII binding in humans and a chimpanzee. (A) Signal tracks for a peak found only in the chimpanzee. All ten individuals shown in Fig. S11B. B) Pie charts displaying occupancy by PolII of genomic regions where the chimp and human genomes are in synteny.
Similar articles
- Effects of sequence variation on differential allelic transcription factor occupancy and gene expression.
Reddy TE, Gertz J, Pauli F, Kucera KS, Varley KE, Newberry KM, Marinov GK, Mortazavi A, Williams BA, Song L, Crawford GE, Wold B, Willard HF, Myers RM. Reddy TE, et al. Genome Res. 2012 May;22(5):860-9. doi: 10.1101/gr.131201.111. Epub 2012 Feb 2. Genome Res. 2012. PMID: 22300769 Free PMC article. - In vivo binding of NF-kappaB to the IkappaBbeta promoter is insufficient for transcriptional activation.
Griffin BD, Moynagh PN. Griffin BD, et al. Biochem J. 2006 Nov 15;400(1):115-25. doi: 10.1042/BJ20060786. Biochem J. 2006. PMID: 16792530 Free PMC article. - Site-specific phosphorylation of the p65 protein subunit mediates selective gene expression by differential NF-κB and RNA polymerase II promoter recruitment.
Hochrainer K, Racchumi G, Anrather J. Hochrainer K, et al. J Biol Chem. 2013 Jan 4;288(1):285-93. doi: 10.1074/jbc.M112.385625. Epub 2012 Oct 25. J Biol Chem. 2013. PMID: 23100252 Free PMC article. - TCL1A, a Novel Transcription Factor and a Coregulator of Nuclear Factor _κ_B p65: Single Nucleotide Polymorphism and Estrogen Dependence.
Ho MF, Lummertz da Rocha E, Zhang C, Ingle JN, Goss PE, Shepherd LE, Kubo M, Wang L, Li H, Weinshilboum RM. Ho MF, et al. J Pharmacol Exp Ther. 2018 Jun;365(3):700-710. doi: 10.1124/jpet.118.247718. Epub 2018 Mar 28. J Pharmacol Exp Ther. 2018. PMID: 29592948 Free PMC article. - Understanding the recent evolution of the human genome: insights from human-chimpanzee genome comparisons.
Kehrer-Sawatzki H, Cooper DN. Kehrer-Sawatzki H, et al. Hum Mutat. 2007 Feb;28(2):99-130. doi: 10.1002/humu.20420. Hum Mutat. 2007. PMID: 17024666 Review.
Cited by
- Whole-genome and whole-exome sequencing in neurological diseases.
Foo JN, Liu JJ, Tan EK. Foo JN, et al. Nat Rev Neurol. 2012 Sep;8(9):508-17. doi: 10.1038/nrneurol.2012.148. Epub 2012 Jul 31. Nat Rev Neurol. 2012. PMID: 22847385 Review. - Removing reference mapping biases using limited or no genotype data identifies allelic differences in protein binding at disease-associated loci.
Buchkovich ML, Eklund K, Duan Q, Li Y, Mohlke KL, Furey TS. Buchkovich ML, et al. BMC Med Genomics. 2015 Jul 26;8:43. doi: 10.1186/s12920-015-0117-x. BMC Med Genomics. 2015. PMID: 26210163 Free PMC article. - Characterization of sequence determinants of enhancer function using natural genetic variation.
Yang MG, Ling E, Cowley CJ, Greenberg ME, Vierbuchen T. Yang MG, et al. Elife. 2022 Aug 31;11:e76500. doi: 10.7554/eLife.76500. Elife. 2022. PMID: 36043696 Free PMC article. - An atlas of the Epstein-Barr virus transcriptome and epigenome reveals host-virus regulatory interactions.
Arvey A, Tempera I, Tsai K, Chen HS, Tikhmyanova N, Klichinsky M, Leslie C, Lieberman PM. Arvey A, et al. Cell Host Microbe. 2012 Aug 16;12(2):233-45. doi: 10.1016/j.chom.2012.06.008. Cell Host Microbe. 2012. PMID: 22901543 Free PMC article. - Circadian clock dysfunction in human omental fat links obesity to metabolic inflammation.
Maury E, Navez B, Brichard SM. Maury E, et al. Nat Commun. 2021 Apr 22;12(1):2388. doi: 10.1038/s41467-021-22571-9. Nat Commun. 2021. PMID: 33888702 Free PMC article.
References
- Rockman MV, Kruglyak L. Nat Rev Genet. 2006 Nov;7:862. - PubMed
- Skelly DA, Ronald J, Akey JM. Annu Rev Genomics Hum Genet. 2009;10:313. - PubMed
- Borneman AR, et al. Science. 2007 Aug 10;317:815. - PubMed
Publication types
MeSH terms
Substances
Grants and funding
- R01 CA077808-09/CA/NCI NIH HHS/United States
- T32GM07205/GM/NIGMS NIH HHS/United States
- R01 CA077808/CA/NCI NIH HHS/United States
- U54 HG004558/HG/NHGRI NIH HHS/United States
- U54 HG004558-04/HG/NHGRI NIH HHS/United States
- T32 GM007205/GM/NIGMS NIH HHS/United States
- Howard Hughes Medical Institute/United States
- T32 GM007205-34/GM/NIGMS NIH HHS/United States
LinkOut - more resources
Full Text Sources
Other Literature Sources
Miscellaneous


