Functional hierarchy and reversibility within the murine spermatogenic stem cell compartment - PubMed (original) (raw)
Functional hierarchy and reversibility within the murine spermatogenic stem cell compartment
Toshinori Nakagawa et al. Science. 2010.
Abstract
Stem cells support tissue maintenance by balancing self-renewal and differentiation. In mice, it is believed that a homogeneous stem cell population of single spermatogonia supports spermatogenesis, and that differentiation, which is accompanied by the formation of connected cells (cysts) of increasing length, is linear and nonreversible. We evaluated this model with the use of lineage analysis and live imaging, and found that this putative stem cell population is not homogeneous. Instead, the stem cell pool that supports steady-state spermatogenesis is contained within a subpopulation of single spermatogonia. We also found that cysts are not committed to differentiation and appear to recover stem cell potential by fragmentation, and that the fate of individual spermatogonial populations was markedly altered during regeneration after damage. Thus, there are multiple and reversible paths from stem cells to differentiation, and these may also occur in other systems.
Figures
Figure 1. The “As model” and hierarchical gene expression between cysts of As, Apr and Aal spermatogonia
(A) A schematic representation of the “As model”. Arrows indicate the proposed flows of the cells in each cyst type. The width of the open arrow reflects the relative probability of the each cyst type to differentiate. (B) Whole-mount immunofluorescence for GFP and GFRα1 in Ngn3/EGFP mouse seminiferous tubules. Arrows and arrowheads indicate NGN3+ (GFP+) and GFRα1+ cells, respectively. Bar, 100 μm. (C, D) Summarized cell counts from immunostaining shown in (B). (C) indicates the total frequency of single and double-positive spermatogonia regardless of the cyst length, and (D) indicates the frequency of single and double-positive cysts harboring the indicated number of cells. The number of counted cells (C) and cysts (D) are shown above each bar. In (D), cysts of other than 2n cells are omitted. (E) Whole-mount immunofluorescense using a mixture of anti-GFP and anti-GFRα1 antibodies (green), and anti-E-CAD antibody (magenta) in Ngn3/EGFP mouse seminiferous tubules. Summarized counts are shown under the panel. Bar, 100 μm.
Figure 2. Behavior of the NGN3+ population in steady-state spermatogenesis
(A) Schedule for (B-G). Ngn3/CreER™;CAG-CAT-EGFP mice were administrated with 4OH-tamoxifen. 2, 10, 20 d after pulse, their testes were analyzed. (B–G) Whole-mount staining of the seminiferous tubules for EGFP and E-CAD (B, E), GFRα1 (C, F), or KIT (D, G) 2 d or 10 d after pulse. Bars, 100 μm. (H) Contribution of pulse-labeled cells to the E-CAD+ total population. Average ± SEM from 5, 3, and 5 testes for days 2, 10, and 20, respectively, are shown. *P = 0.006, **P <0.001, respectively, against the values of day 2 (Student’s _t_-test). (I) Selected frames from live-imaging (Mov. S1) in Ngn3/GFP mouse testes. Orange, yellow, and green arrowheads indicate the gain of GFP fluorescence in As, Aal-4 and, probable Aal-8, respectively. The indicated As divided into an Apr· *, a blood vessel.
Figure 3. Behavior of NGN3+ As in steady-state spermatogenesis
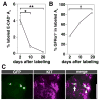
(A) Percentage of labeled As in E-CAD+ As in testes of Ngn3/CreER™;CAG-CAT-EGFP mice 2, 10, and 20 d after pulse-labeling. Average ± SEM from 5, 3, and 5 testes for 2, 10, and 20 d, respectively, are shown. *P = 0.006, **P < 0.001 (Student’s t_-test). (B) Percentage of GFRα1+ cells in labeled As spermatogonia. Total numbers of GFP-tagged As for 2, 10, and 20 d are 171, 8, and 6, respectively. †_P < 0.02 (χ2 test). (C) Whole-mount seminiferous tubules stained for GFP (green) and KIT (magenta) 2 d after pulse-labeling, indicating rare examples of GFP/KIT double-positive As and Apr cells, observed at the frequency of one out of approx. 10–20 GFP-tagged E-CAD+ As cells. Bar, 100 μm.
Figure 4. Clone fragmentation of NGN3+ Aal spermatogonia
Selected frames from live-imaging of an Ngn3/GFP transgenic mouse testis (Mov. S2) (A) and their schematic representation (B), indicating fragmentation of NGN3+ Aal spermatogonia. Following synchronous division of an Aal-8 cyst, two pairs of connected cells, indicated by magenta and orange arrowheads in (A) and dots in (B), survive: the remaining cells in the large chain subsequently died (light blue arrowheads in A). Elapsed time is indicated.
Figure 5. Behavior of spermatogonial subpopulations during regeneration
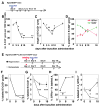
(A–D) Analysis of the As, Apr and Aal subpopulations following administration of a submarginal dose of busulfan into Ngn3/EGFP adult mice. According to the schedule in (A), testes were processed for cell counting by whole-mount immunofluorescence. (B), (C), and (D) indicate the number of total (E-CAD+) As, Apr and Aal spermatogonia per 1000 Sertoli cells, the average length of E-CAD+ cysts, and the percentage of GFRα1+ (magenta) and NGN3+ (green) As, Apr and Aal spermatogonia within the total E-CAD+ population, respectively. Values are shown as average ± SEM (n = 6, 6, and 3, for all the data points in (B), (C), and (D), respectively). *P < 0.006, **P < 0.001, respectively, against the values of day 0 (Student’s t_-test). (E–I) Pulse-label analyses of NGN3+ spermatogonia during regeneration (closed circles) and steady-state (open circles). Two days after the pulse, Ngn3/CreER™;CAG-CAT-EGFP doubly-transgenic mice were injected with busulfan to induce regeneration. In the control steady-state group, busulfan treatment was omitted. (F) and (G) represent the percent labeled cells in E-CAD+ total (As, Apr and Aal) and E-CAD+ As populations, respectively, following schedule in (E). (H) The percent GFRα1+ As cells in the total GFP-labeled As population. Total numbers of GFP-tagged As for 0, 8, and 18 d are 171, 24, and 108, respectively. †_P < 0.006 (χ2 test). (I) The percent GFP-labeled cellswithin the GFRα1+ As population. Average ± SEM from 5, 3, and 5 testes for days 0, 8, and 18, respectively, are shown in (F, G, and I). *P < 0.03, **P < 0.006, ***P < 0.001 (Student’s _t_-test). Data for steady-state in (F) and (G) are reproduced from Figs. 2 and 3, respectively.
Figure 6. Subpopulations of spermatogonia and their behaviors
Proposed spermatogonial subpopulations and their behavior in regards to their morphology (cyst length) and gene expression (GFRα1+ and NGN3+). The black arrows indicate the proposed flow of the majority of cells in each morphological group. The dotted lines show the observed modes of “reversion”. Arrows without asterisks were actually observed; those with asterisks were not observed but are proposed to occur with high probabilities.
Comment in
- Counterfeiting the family jewels.
Spradling A, Fan CM. Spradling A, et al. Cell Stem Cell. 2010 May 7;6(5):405-6. doi: 10.1016/j.stem.2010.04.012. Cell Stem Cell. 2010. PMID: 20452312
Similar articles
- The RNA-binding protein NANOS2 is required to maintain murine spermatogonial stem cells.
Sada A, Suzuki A, Suzuki H, Saga Y. Sada A, et al. Science. 2009 Sep 11;325(5946):1394-8. doi: 10.1126/science.1172645. Science. 2009. PMID: 19745153 - Stem cell heterogeneity: actual and potential stem cell compartments in mouse spermatogenesis.
Yoshida S, Nabeshima Y, Nakagawa T. Yoshida S, et al. Ann N Y Acad Sci. 2007 Dec;1120:47-58. doi: 10.1196/annals.1411.003. Epub 2007 Sep 28. Ann N Y Acad Sci. 2007. PMID: 17905929 Review. - Hierarchical differentiation competence in response to retinoic acid ensures stem cell maintenance during mouse spermatogenesis.
Ikami K, Tokue M, Sugimoto R, Noda C, Kobayashi S, Hara K, Yoshida S. Ikami K, et al. Development. 2015 May 1;142(9):1582-92. doi: 10.1242/dev.118695. Epub 2015 Apr 9. Development. 2015. PMID: 25858458 Free PMC article. - Functional identification of the actual and potential stem cell compartments in mouse spermatogenesis.
Nakagawa T, Nabeshima Y, Yoshida S. Nakagawa T, et al. Dev Cell. 2007 Feb;12(2):195-206. doi: 10.1016/j.devcel.2007.01.002. Dev Cell. 2007. PMID: 17276338 - [Biological properties of spermatogonial stem cell niches].
Li LL, Liu Y, Jin B, Zhang XM. Li LL, et al. Zhonghua Nan Ke Xue. 2012 Apr;18(4):359-63. Zhonghua Nan Ke Xue. 2012. PMID: 22574376 Review. Chinese.
Cited by
- Transcription Factor GLIS3: A New and Critical Regulator of Postnatal Stages of Mouse Spermatogenesis.
Kang HS, Chen LY, Lichti-Kaiser K, Liao G, Gerrish K, Bortner CD, Yao HH, Eddy EM, Jetten AM. Kang HS, et al. Stem Cells. 2016 Nov;34(11):2772-2783. doi: 10.1002/stem.2449. Epub 2016 Jul 11. Stem Cells. 2016. PMID: 27350140 Free PMC article. - Extrinsic and intrinsic factors controlling spermatogonial stem cell self-renewal and differentiation.
Mei XX, Wang J, Wu J. Mei XX, et al. Asian J Androl. 2015 May-Jun;17(3):347-54. doi: 10.4103/1008-682X.148080. Asian J Androl. 2015. PMID: 25657085 Free PMC article. Review. - A single-cell view of spermatogonial stem cells.
Tan K, Wilkinson MF. Tan K, et al. Curr Opin Cell Biol. 2020 Dec;67:71-78. doi: 10.1016/j.ceb.2020.07.005. Epub 2020 Sep 17. Curr Opin Cell Biol. 2020. PMID: 32950921 Free PMC article. Review. - Effects of multiple doses of cyclophosphamide on mouse testes: accessing the germ cells lost, and the functional damage of stem cells.
Drumond AL, Weng CC, Wang G, Chiarini-Garcia H, Eras-Garcia L, Meistrich ML. Drumond AL, et al. Reprod Toxicol. 2011 Dec;32(4):395-406. doi: 10.1016/j.reprotox.2011.09.010. Epub 2011 Oct 7. Reprod Toxicol. 2011. PMID: 22001253 Free PMC article. - Transcriptional control of spermatogonial maintenance and differentiation.
Song HW, Wilkinson MF. Song HW, et al. Semin Cell Dev Biol. 2014 Jun;30:14-26. doi: 10.1016/j.semcdb.2014.02.005. Epub 2014 Feb 19. Semin Cell Dev Biol. 2014. PMID: 24560784 Free PMC article. Review.
References
- Seydoux G, Braun RE. Cell. 2006;127:891. - PubMed
- Fuller MT, Spradling AC. Science. 2007;316:402. - PubMed
- Brawley C, Matunis E. Science. 2004;304:1331. - PubMed
- Kai T, Spradling A. Nature. 2004;428:564. - PubMed
Publication types
MeSH terms
Substances
LinkOut - more resources
Full Text Sources
Medical
Molecular Biology Databases


