Dynamic regulation of Gata1 expression during the maturation of conventional dendritic cells - PubMed (original) (raw)
Dynamic regulation of Gata1 expression during the maturation of conventional dendritic cells
Gergely T Kozma et al. Exp Hematol. 2010 Jun.
Abstract
Objectives: To identify the regulatory sequences driving Gata1 expression in conventional dendritic cells (cDC).
Materials and methods: The number and expression levels of Gata1, Gata1-target genes and hypersensitive site (HS) 2 (the eosinophil-specific enhancer)-driven green fluorescent protein (GFP) reporter of cDCs from mice lacking HS1 (the erythroid/megakaryocytic-specific enhancer, Gata1(low) mutation) and wild-type littermates, as well as the response to lipopolysaccharide of ex vivo-generated wild-type and Gata1(low) DCs were investigated.
Results: cDC maturation was associated with bell-shaped changes in Gata1 expression that peaked in cDCs precursors from blood. The Gata1(low) mutation did not affect Gata1 expression in cDC precursors and these cells expressed the HS2-driven reporter, indicating that Gata1 expression is HS2-driven in these cells. By contrast, the Gata1(low) mutation reduced Gata1 expression in mature cDCs and these cells did not express GFP, indicating that mature cDCs express Gata1 driven by HS1. In blood, the number of cDC precursors expressing CD40/CD80 was reduced in Gata1(low) mice, while CD40(pos)/CD80(pos) cDC precursors from wild-type mice expressed the HS2-GFP reporter, suggesting that Gata1 expression in these cells is both HS1- and HS2-driven. In addition, the antigen and accessory molecules presentation process induced by lipopolysaccharide in ex vivo-generated wild-type DC was associated with increased acetylated histone 4 occupancy of HS1, while ex vivo-generated Gata1(low) cDCs failed to respond to lipopolysaccharide, suggesting that HS1 activation is required for cDC maturation.
Conclusion: These results identify a dynamic pattern of Gata1 regulation that switches from an HS1 to an HS2-dependent phase during the maturation of cDCs associated with the antigen-presentation process in the blood.
Copyright 2010 ISEH - Society for Hematology and Stem Cells. Published by Elsevier Inc. All rights reserved.
Figures
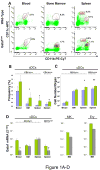
Figure 1. The hypomorphic Gata1low mutation increases the number of precursors and mature cDCs present in the spleen and decreases Gata1 expression in cDC precursors from the blood and in mature cDCs in the spleen
A) Representative flow cytometrical analysis for CD11b/CD11c expression and frequency (B) and absolute number (C) of precursor and mature cDCs (B220-/CD11b+/CD11clow or CD11chigh, respectively) in blood, bone marrow and spleen from wild-type (blue bars) and Gata1low (green bars) littermates. The B220 gating is presented in Supplementary Figure 1. Frequencies observed in 4-9 mice per group are presented as mean (±SD) of results. C) Absolute numbers were calculated by multiplying the frequency presented in B with the total cell number (Supplementary Table 1). D) Levels of Gata1 mRNA expressed by cDC populations (B220-/CD11b+/CD11clow or CD11chigh) prospectively isolated from blood, marrow and spleen, compared with the levels of Gata1 expressed by megakaryocytes (MK, CD41+/CD61+) and erythroid cells (Ery, CD119+/CD71+) purified from the marrow of the same animals. Expression levels are expressed as 2-ΔCt and are presented as mean (±SD) of results obtained in 3 independent determinations per experimental point. Values statistically different by unpaired T-test analyses are indicated by * (p<0.05) and ** (p<0.01).
Figure 2. Levels of expression of genes involved in the control of maturation (Pu.1), proliferation (Cyclin D6 and p27Kip1), apoptosis (Bcl2) or encoding maturation (CD40 and CD86) and known Gata1-target (Ifnγ) proteins in CD11clow cDCc purified from the bone marrow (BM), blood (B) and spleen (S) of wild-type (top panels) and Gata1low (bottom panels) mice
Cells were purified according to gates described in Figure 1. mRNA levels are expressed as 2-ΔCt and presented as mean (±SD) of values observed with cells independently purified from 3 wild-type and 3 Gata1low mice. Statistically significant differences (p<0.05) between values observed with corresponding wild-type and Gata1low cells and between values observed in BM vs B and, S or in B vs BM and S within the same animal group are indicated with *, & and ‡, respectively.
Figure 3. Conventional dendrititc cell (cDC) precursors from the blood express reduced levels of a reporter gene driven by the regulatory sequences of Gata1 spared by the Gata1low mutation
A) Organization of the Gata1 locus showing the position of the two promoters, the proximal (IE) and the distal (IT) promoter [36] and of two DNase hypersensitive sites, HS1 and HS2 [29-34]. The scissors mark the region deleted by the Gata1low mutation while the sequences -2.7 Kb upstream and 1.5 Kb downstream of the IE promoter that drive expression of the reporter (-2.7KbGata1GPF) are indicated with a line. B) Flow cytometrical determinations of the expression of the reporter gene by cDCs (B220-/CD11b+/CD11clow or CD11chigh, see Figure 1) from blood, bone marrow and spleen of -2.7kbGata1GFP∷Gata1+/y and C) -2.7kbGata1GFP∷Gata1low/y male littermates presented as contour-plots. The top panels present the levels of GFP expressed by cCDs from the marrow of wild-type and Gata1low mice not carrying the reporter gene.
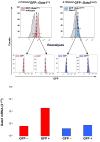
Figure 4. Conventional dendrititc cell (cDC) precursors present in the blood that express the GFP reporter express high levels of Gata1
Levels of Gata1 mRNA expressed by cDCs (B220-/CD11b+/CD11clow, see Figure 1) prospectively isolated from the blood of -2.7kbGata1GFP∷Gata1+/y (left panels, red) and -2.7kbGata1GFP∷Gata1low/y (right panels, blue) mice, according to their levels of GFP expression. Negative controls are presented as gray histograms. The gating used for the purification and the reanalysis of the sorted cells for purity are presented in the top and middle panels, respectively. mRNA levels are expressed as 2-ΔCt. A representative experiment is presented.
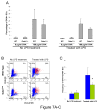
Figure 5. The hypomorphic Gata1low mutation hampers the ability of conventional dendrititc cells (cDC) from the blood to express CD40 and CD86 on their surface
A) Frequency of cDCs (B220-/CD11b+/CD11clow or CD11chigh) expressing the accessory molecules CD40 (red) and CD86 (blue) in blood and spleen of wild-type (light red and blue) and Gata1low (dark red and blue) littermates. CD40 and CD86 positive cDCs in the marrow were below detectable levels. Results are presented as mean (±SD) of 3 independent determinations per experimental point. Values statistically different by unpaired T-test analyses are indicated by * (p<0.05). B) Four color flow cytometrical analyses for the expression of the HS2-driven reporter and of CD40 (top panels) or CD86 (bottom panels) by the cDCs (B220-/CD11b+/CD11clow, see Figure 1) in the blood from -2.7kbGata1GFP∷Gata1+/y and -2.7kbGata1GFP∷Gata1low/y littermates.
Figure 6. The presence of the Gata1low mutation hampers the ability of bone marrow cells to generate DCs ex vivo in response to GM-CSF
Flow cytometrical analyses for the expression of CD11b in combination with B220 (left panels), CD11c (second panels) or Gr1 (third panels) of cells obtained after 6 days in GM-CSF-stimulated cultures of bone marrow cells from wild-type (top panels) and Gata1low (bottom panels) mice. May-Grunwald staining of representative cells is presented on the right. Representative cells with neutrophil- and DC-like morphology are indicated by arrows and arrowheads, respectively. Magnification 40×. Similar results were obtained in three additional experiments.
Figure 7. Ex-vivo generated Gata1low cDCs have impaired ability to express the antigen and accessory molecules on the cell surface in response to LPS
A) Levels of OVA uptaken by DCs generated ex vivo from wild-type and Gata1low bone marrow cells and exposed or not to LPS. B) Representative FACS analysis of surface expression of OVA and CD40 by ex-vivo generated DCs. The mean (±SD) frequency of double OVA and CD40 positive cDCs observed in 3 independent experiments is presented in C. Values statistically different by unpaired T-test analyses are indicated as *(p<0.05). D) Levels of Gata1, Pu.1, CD40, CD86 and Ifnγ expressed by DCs expanded ex-vivo from bone marrow cells of wild-type (upper panels) or Gata1low (bottom panels) mice in the presence of GM-CSF and IL-4 and stimulated (green) or not (yellow) for 24 hr with LPS. Results are presented as 2-ΔΔCt with respect to values observed in −LPS samples and are presented as mean (±SD) of values observed in 3 independent experiments. Non-stimulated wild-type and Gata1low DCs expressed comparable levels of all the genes investigated (not shown). Statistically significant differences (p<0.05) between values observed − and + LPS-stimulation within the same mouse group are indicated by § while statistically significant differences between values observed between LPS-stimulated wild-type and Gata1low cells are indicated with *.
Figure 8. LPS induces AcH4 and reduces K27Me3H3 occupancy at the HS1 region of Gata1 in DCs expanded ex-vivo from wild-type mice
ChIP was performed with anti-AcH4 and anti-K27Me3H3 antibodies using chromatin prepared from wild-type DCs expanded in the presence of GM-CSF and pulsed (bottom left panel) or not (top left panel) with LPS for 18hr. Controls for LPS stimulations were represented by ChIP analysis of the LPS-inducible GATA binding site of the Ifnγ promoter (top right panel) and flow cytometrical analysis for CD40 and CD86 surface expression (bottom right panels). AcH4 and K27Me3H3 binding is expressed as relative fold enrichment (RFE) after subtracting anti-GST antibody binding (negative control).
Figure 9. A model describing the regulatory regions driving Gata1 expression during the maturation of DCs
A model is proposed to characterize a dynamic pattern of chromatin configuration in DCs that sequentially recruits the HS1 and HS2 enhancer to control Gata1 expression. In CD11clow cells, Gata1 expression is driven by HS2. In blood cDC precursors, Gata1 expression is controlled by HS2 and HS1 in combination. In mature cDCs from spleen, Gata1 expression is under the control of HS1.
Similar articles
- Gata1 regulates dendritic-cell development and survival.
Gutiérrez L, Nikolic T, van Dijk TB, Hammad H, Vos N, Willart M, Grosveld F, Philipsen S, Lambrecht BN. Gutiérrez L, et al. Blood. 2007 Sep 15;110(6):1933-41. doi: 10.1182/blood-2006-09-048322. Epub 2007 May 15. Blood. 2007. PMID: 17505015 Free PMC article. - Deletion of a negatively acting sequence in a chimeric GATA-1 enhancer-long terminal repeat greatly increases retrovirally mediated erythroid expression.
Testa A, Lotti F, Cairns L, Grande A, Ottolenghi S, Ferrari G, Ronchi A. Testa A, et al. J Biol Chem. 2004 Mar 12;279(11):10523-31. doi: 10.1074/jbc.M313638200. Epub 2003 Dec 29. J Biol Chem. 2004. PMID: 14701820 - TLR-activated conventional DCs promote γ-secretase-mediated conditioning of plasmacytoid DCs.
Pérez-Cabezas B, Naranjo-Gómez M, Ruiz-Riol M, Bastos-Amador P, Fernández MA, Carmona F, Nuñez F, Pujol-Borrell R, Borràs FE. Pérez-Cabezas B, et al. J Leukoc Biol. 2012 Jul;92(1):133-43. doi: 10.1189/jlb.0911452. Epub 2012 Apr 24. J Leukoc Biol. 2012. PMID: 22534476 - Zbtb46 expression distinguishes classical dendritic cells and their committed progenitors from other immune lineages.
Satpathy AT, KC W, Albring JC, Edelson BT, Kretzer NM, Bhattacharya D, Murphy TL, Murphy KM. Satpathy AT, et al. J Exp Med. 2012 Jun 4;209(6):1135-52. doi: 10.1084/jem.20120030. Epub 2012 May 21. J Exp Med. 2012. PMID: 22615127 Free PMC article. - The GATA1-HS2 enhancer allows persistent and position-independent expression of a β-globin transgene.
Miccio A, Poletti V, Tiboni F, Rossi C, Antonelli A, Mavilio F, Ferrari G. Miccio A, et al. PLoS One. 2011;6(12):e27955. doi: 10.1371/journal.pone.0027955. Epub 2011 Dec 2. PLoS One. 2011. PMID: 22164220 Free PMC article.
Cited by
- Cellular adhesion gene SELP is associated with rheumatoid arthritis and displays differential allelic expression.
Burkhardt J, Blume M, Petit-Teixeira E, Hugo Teixeira V, Steiner A, Quente E, Wolfram G, Scholz M, Pierlot C, Migliorini P, Bombardieri S, Balsa A, Westhovens R, Barrera P, Radstake TR, Alves H, Bardin T, Prum B, Emmrich F, Cornelis F, Ahnert P, Kirsten H. Burkhardt J, et al. PLoS One. 2014 Aug 22;9(8):e103872. doi: 10.1371/journal.pone.0103872. eCollection 2014. PLoS One. 2014. PMID: 25147926 Free PMC article. - GATA1 controls numbers of hematopoietic progenitors and their response to autoimmune neuroinflammation.
Hwang D, Ishikawa LLW, Seyedsadr MS, Mari E, Kasimoglu E, Sahin Z, Boehm A, Jang S, Rasouli J, Vaccaro C, Gonzalez M, Hakonarson H, Rostami A, Zhang GX, Ciric B. Hwang D, et al. Blood Adv. 2022 Dec 13;6(23):5980-5994. doi: 10.1182/bloodadvances.2022008234. Blood Adv. 2022. PMID: 36206195 Free PMC article. - High MafB expression following burn augments monocyte commitment and inhibits DC differentiation in hemopoietic progenitors.
Howell K, Posluszny J, He LK, Szilagyi A, Halerz J, Gamelli RL, Shankar R, Muthu K. Howell K, et al. J Leukoc Biol. 2012 Jan;91(1):69-81. doi: 10.1189/jlb.0711338. Epub 2011 Oct 7. J Leukoc Biol. 2012. PMID: 21984745 Free PMC article. - GATA factor mutations in hematologic disease.
Crispino JD, Horwitz MS. Crispino JD, et al. Blood. 2017 Apr 13;129(15):2103-2110. doi: 10.1182/blood-2016-09-687889. Epub 2017 Feb 8. Blood. 2017. PMID: 28179280 Free PMC article. Review. - GATA1 insufficiencies in primary myelofibrosis and other hematopoietic disorders: consequences for therapy.
Ling T, Crispino JD, Zingariello M, Martelli F, Migliaccio AR. Ling T, et al. Expert Rev Hematol. 2018 Mar;11(3):169-184. doi: 10.1080/17474086.2018.1436965. Epub 2018 Feb 19. Expert Rev Hematol. 2018. PMID: 29400094 Free PMC article. Review.
References
- Watts C. Capture and processing of exogenous antigens for presentation on MHC molecules. Annu Rev Immunol. 1997;15:821–850. - PubMed
- Shortman K, Liu YJ. Mouse and human dendritic cell subtypes. Nat Rev Immunol. 2002;2:151–161. - PubMed
- Theofilopoulos AN, Baccala R, Beutler B, Kono DH. Type I interferons (alpha/beta) in immunity and autoimmunity. Annu Rev Immunol. 2005;23:307–336. - PubMed
- Asselin-Paturel C, Boonstra A, Dalod M, et al. Mouse type I IFN-producing cells are immature APCs with plasmacytoid morphology. Nat Immunol. 2001;2:1144–1150. - PubMed
Publication types
MeSH terms
Substances
LinkOut - more resources
Full Text Sources
Molecular Biology Databases
Research Materials
Miscellaneous


