The sexually antagonistic genes of Drosophila melanogaster - PubMed (original) (raw)
The sexually antagonistic genes of Drosophila melanogaster
Paolo Innocenti et al. PLoS Biol. 2010.
Abstract
When selective pressures differ between males and females, the genes experiencing these conflicting evolutionary forces are said to be sexually antagonistic. Although the phenotypic effect of these genes has been documented in both wild and laboratory populations, their identity, number, and location remains unknown. Here, by combining data on sex-specific fitness and genome-wide transcript abundance in a quantitative genetic framework, we identified a group of candidate genes experiencing sexually antagonistic selection in the adult, which correspond to 8% of Drosophila melanogaster genes. As predicted, the X chromosome is enriched for these genes, but surprisingly they represent only a small proportion of the total number of sex-biased transcripts, indicating that the latter is a poor predictor of sexual antagonism. Furthermore, the majority of genes whose expression profiles showed a significant relationship with either male or female adult fitness are also sexually antagonistic. These results provide a first insight into the genetic basis of intralocus sexual conflict and indicate that genetic variation for fitness is dominated and maintained by sexual antagonism, potentially neutralizing any indirect genetic benefits of sexual selection.
Conflict of interest statement
The authors have declared that no competing interests exist.
Figures
Figure 1. Fitness assay data.
(A) Average male and female adult relative fitness (male fertilization success and female fecundity) across 100 hemiclonal lines. (B) Interaction plot of male and female fitness rank for each hemiclone line. In both panels, the 15 selected lines are highlighted in blue (high-male/low-female fitness), red (low-male/high-female fitness), or black (average male and female fitness).
Figure 2. Gene expression data.
Mean expression values in males and females for each transcript. (A) Male-biased and female-biased transcripts showing 2-fold or greater differences in gene expression are represented with blue and red dots, respectively. (B) Purple dots represent transcripts showing significant interaction between sex and fitness in the regression on gene expression.
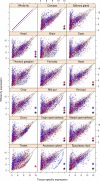
Figure 3. Tissue-specific expression of genes associated with male fitness.
Expression levels of transcripts in different tissues (_x_-axis) against the expression levels in the whole fly (_y_-axis); data from FlyAtlas . The green line represents the cut-off below which the transcripts are considered tissue-specific. Blue and red dots represent the transcripts positively and negatively associated with male fitness, respectively. Black, blue, and red asterisks represent tissues significantly enriched (adjusted p value <0.01) for tissue-specific transcripts associated with male fitness (black, overall; blue, positively associated; red, negatively associated).
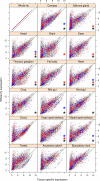
Figure 4. Tissue-specific expression of genes associated with female fitness.
Expression levels of transcripts in different tissues (_x_-axis) against the expression levels in the whole fly (_y_-axis); data from FlyAtlas . The green line represents the cut-off below which the transcripts are considered tissue-specific. Blue and red dots represent the transcripts positively and negatively associated with female fitness, respectively. Black, blue, and red asterisks represent tissues significantly enriched (adjusted p value <0.01) for tissue-specific transcripts associated with female fitness (black, overall; blue, positively associated; red, negatively associated).
Figure 5. Venn diagram.
Intersections between genes significantly (positively or negatively) associated with male fitness, female fitness (from the sex-specific models), and those that show a significant interaction between sex and fitness in the full model (i.e., sexually antagonistic).
Figure 6. Chromosomal distribution of sexually antagonistic candidate genes.
Chromosomes, chromosomal bands (1–100), and sub-bands (A–F in each band, not labelled but qualitatively indicated by their relative position in each band), enriched for sexually antagonistic candidate genes are coloured in light blue, blue, and dark blue, respectively. See Table S5 for details and statistics.
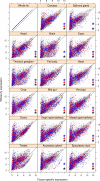
Figure 7. Tissue-specific expression of sexually antagonistic candidate genes.
Expression levels of transcripts in different tissues (_x_-axis) against the expression levels in the whole fly (_y_-axis); data from FlyAtlas . The green line represents the cut-off below which the transcripts are considered tissue-specific. Blue and red dots represent the male-beneficial and female-beneficial transcripts, respectively. Black, blue, and red asterisks represent tissues significantly enriched (adjusted p value <0.01) for tissue-specific antagonistic genes (black, overall; blue, male-beneficial; red, female-beneficial).
Comment in
- Synopsis. Identifying genes that help one sex but harm the other.
Meadows R. Meadows R. PLoS Biol. 2010 Mar 16;8(3):e1000336. doi: 10.1371/journal.pbio.1000336. PLoS Biol. 2010. PMID: 20305720 Free PMC article. No abstract available. - Where sexes collide.
Casci T. Casci T. Nat Rev Genet. 2010 May;11(5):316. doi: 10.1038/nrg2787. Nat Rev Genet. 2010. PMID: 20419862 No abstract available.
Similar articles
- Genome-wide sexually antagonistic variants reveal long-standing constraints on sexual dimorphism in fruit flies.
Ruzicka F, Hill MS, Pennell TM, Flis I, Ingleby FC, Mott R, Fowler K, Morrow EH, Reuter M. Ruzicka F, et al. PLoS Biol. 2019 Apr 25;17(4):e3000244. doi: 10.1371/journal.pbio.3000244. eCollection 2019 Apr. PLoS Biol. 2019. PMID: 31022179 Free PMC article. - Genetic drift in antagonistic genes leads to divergence in sex-specific fitness between experimental populations of Drosophila melanogaster.
Hesketh J, Fowler K, Reuter M. Hesketh J, et al. Evolution. 2013 May;67(5):1503-10. doi: 10.1111/evo.12032. Epub 2013 Jan 28. Evolution. 2013. PMID: 23617925 - Experimental evolution of a novel sexually antagonistic allele.
Dean R, Perry JC, Pizzari T, Mank JE, Wigby S. Dean R, et al. PLoS Genet. 2012;8(8):e1002917. doi: 10.1371/journal.pgen.1002917. Epub 2012 Aug 30. PLoS Genet. 2012. PMID: 22956914 Free PMC article. - Intralocus sexual conflict.
van Doorn GS. van Doorn GS. Ann N Y Acad Sci. 2009 Jun;1168:52-71. doi: 10.1111/j.1749-6632.2009.04573.x. Ann N Y Acad Sci. 2009. PMID: 19566703 Review. - Rapid evolutionary change, constraints and the maintenance of polymorphism in natural populations of Drosophila melanogaster.
Glaser-Schmitt A, Ramnarine TJS, Parsch J. Glaser-Schmitt A, et al. Mol Ecol. 2024 May;33(10):e17024. doi: 10.1111/mec.17024. Epub 2023 May 24. Mol Ecol. 2024. PMID: 37222070 Review.
Cited by
- Sex-differential selection and the evolution of X inactivation strategies.
Connallon T, Clark AG. Connallon T, et al. PLoS Genet. 2013 Apr;9(4):e1003440. doi: 10.1371/journal.pgen.1003440. Epub 2013 Apr 18. PLoS Genet. 2013. PMID: 23637618 Free PMC article. - The search for sexually antagonistic genes: Practical insights from studies of local adaptation and statistical genomics.
Ruzicka F, Dutoit L, Czuppon P, Jordan CY, Li XY, Olito C, Runemark A, Svensson EI, Yazdi HP, Connallon T. Ruzicka F, et al. Evol Lett. 2020 Aug 31;4(5):398-415. doi: 10.1002/evl3.192. eCollection 2020 Oct. Evol Lett. 2020. PMID: 33014417 Free PMC article. - A general population genetic framework for antagonistic selection that accounts for demography and recurrent mutation.
Connallon T, Clark AG. Connallon T, et al. Genetics. 2012 Apr;190(4):1477-89. doi: 10.1534/genetics.111.137117. Epub 2012 Jan 31. Genetics. 2012. PMID: 22298707 Free PMC article. - Constraints on the coevolution of contemporary human males and females.
Stearns SC, Govindaraju DR, Ewbank D, Byars SG. Stearns SC, et al. Proc Biol Sci. 2012 Dec 7;279(1748):4836-44. doi: 10.1098/rspb.2012.2024. Epub 2012 Oct 3. Proc Biol Sci. 2012. PMID: 23034705 Free PMC article. - Pleiotropy Modulates the Efficacy of Selection in Drosophila melanogaster.
Fraïsse C, Puixeu Sala G, Vicoso B. Fraïsse C, et al. Mol Biol Evol. 2019 Mar 1;36(3):500-515. doi: 10.1093/molbev/msy246. Mol Biol Evol. 2019. PMID: 30590559 Free PMC article.
References
- Rice W. R. Sex chromosomes and the evolution of sexual dimorphism. Evolution Int J Org Evolution. 1984;38:735–742. - PubMed
- Parker G. A. London: Academic Press; 1979. Sexual selection and sexual conflict. pp. 123–166. In: Sexual selection and reproductive competition in insects.
- Trivers R. L. London: Heinemann; 1972. Parental investment and sexual selection. pp. 136–179. In: Sexual selection and the descent of man, 1871-1971.
- Rice W. R, Chippindale A. K. Intersexual ontogenetic conflict. J Evol Biol. 2001;14:685–693.
- Foerster K, Coulson T, Sheldon B. C, Pemberton J. M, Clutton-Brock T, et al. Sexually antagonistic genetic variation for fitness in red deer. Nature. 2007;447:1107–1110. - PubMed
Publication types
MeSH terms
LinkOut - more resources
Full Text Sources
Molecular Biology Databases
Research Materials


