Ephrin-B1 reverse signaling controls a posttranscriptional feedback mechanism via miR-124 - PubMed (original) (raw)
Ephrin-B1 reverse signaling controls a posttranscriptional feedback mechanism via miR-124
Dina N Arvanitis et al. Mol Cell Biol. 2010 May.
Abstract
Eph receptors and ephrins exhibit complex and highly dynamic expression patterns during embryonic development. In addition, changes in their expression levels are often associated with pathological situations in adults. Yet, little is known about the mechanisms regulating their expression. Here we report that the expression of ephrin-B1 is controlled by a feedback loop involving posttranscriptional regulatory mechanisms. We observed that the EfnB1 3' untranslated region (3'-UTR) confers instability to mRNA transcripts, and we identified miR-124 as a posttranscriptional repressor of EfnB1 expression. Furthermore, we showed that miR-124 is itself regulated by ephrin-B1 reverse signaling, thus revealing the existence of a mutually repressive interaction between ephrin-B1 and this microRNA (miRNA). Lastly, we demonstrated the relevance of this mutual inhibition for neuronal differentiation. Our results suggest that miRNAs could be important effectors of Eph/ephrin signaling to refine domains of expression and to regulate function.
Figures
FIG. 1.
The 3′-UTR of EfnB1 causes a decrease in mRNA levels. (A) Endogenous levels of EfnB1 in NPCs were measured by qRT-PCR at different time intervals after actinomycin D treatment. U251 cells were transiently transfected with EfnB1 expression constructs with (pcmv-_EfnB1_-3′-UTR) or without (pcmv-EfnB1) the 3′-UTR, and levels of ectopic EfnB1 transcripts were measured by qRT-PCR at different time intervals after actinomycin D treatment. Results are the means ± standard errors (SE) from 3 independent experiments, each measured in duplicate. (B) U251 cells were transiently transfected with EfnB1 expression constructs with (_EfnB1_-3′-UTR) or without (EfnB1) the 3′-UTR, and steady-state levels of ectopic EfnB1 transcripts were measured by qRT-PCR. Results are the means ± SE from 3 independent experiments, each measured in duplicate.
FIG. 2.
A posttranscriptional regulatory motif is located in the first 450 bp of the EfnB1 3′-UTR. (A) Normalized luciferase activity in U251 cells transfected with either a reporter construct containing the full-length EfnB1 3′-UTR (FL) or a control construct (pmiR-control). (B, left) Schematic representation of various luciferase reporter constructs. The numbers at right indicate the nucleotide positions included in the reporter constructs. (B, right) Corresponding normalized luciferase activity in U251 cells. (C) Normalized luciferase activity in NPCs electroporated with pmiR-control, FL, and T1 reporters. Results are the means ± standard errors from 6 independent experiments, each measured in duplicate. **, significantly different from pmiR-control, P < 0.001; *, significantly different from pmiR-control, P < 0.05.
FIG. 3.
miR-124 targets the 3′-UTR of EfnB1. (A) Normalized luciferase activity in U251 cells cotransfected with FL, T1, or T6 in the absence (−) or presence (+) of a miR-124 expression construct, as indicated. (B) Normalized luciferase activity in U251 cells cotransfected with T1 or a reporter carrying a mutation in the miR-124 binding site (T1*), in the absence or presence of a miR-124 expression construct. (C) Normalized luciferase activity in U251 cells cotransfected with FL, T1, or T6 with (+) or without (−) LNA-124 or scrambled sequences, as indicated. Results are the means ± standard errors (SE) from 3 independent experiments, each measured in duplicate. (D) U251 cells were cotransfected with pcmv-EfnB1 or pcmv-_EfnB1_-3′-UTR in the absence or presence of a miR-124 expression construct, and ephrin-B1 protein levels were determined by Western blot analysis. Quantification of three independent experiments was performed using the Grb2 protein level as a loading control. Results are the means ± SE from 3 independent experiments, each measured in duplicate. (E) E14.5 developing cortices were coelectroporated with a GFP reporter plasmid and with either a scrambled oligonucleotide (a) or a miR-124 (b) expression construct. Images show nuclei in blue and GFP-positive cells in green. Quantification of GFP-positive cells in the VZ is also shown (c). Images are representative of 3 independent electroporations. IZ, intermediate zone. *, P < 0.05; **, P < 0.01.
FIG. 4.
Reverse signaling downregulates miR-124 levels. (A) Wild-type NPCs were stimulated with Fc, EphA4-Fc, or EphB2-Fc, and levels of P-STAT3 and P-ERK were assessed by Western blot analysis (left). Ratios of phosphorylated protein levels versus total protein amounts are shown for both STAT3 and ERK1/2 (right). (B) Wild-type NPCs were stimulated with Fc or EphB2-Fc, and miR-124 levels (left) and miR-200C levels (right) were determined by qPCR. (C) miR-124 levels in wild-type (WT) and _EfnB1_−/− (KO) NPCs were determined by qPCR. Results are the means ± standard errors from 3 independent experiments, each measured in duplicate. *, P < 0.05. (D) In situ hybridization of coronal sections of E13.5 wild-type (a, b, d, and e) and _EfnB1_−/− (c and f) embryos, carried out using either a scrambled LNA as a control (a and d) or LNA-124 as a probe for miR-124 expression (b, c, e, and f). Two different samples at two different magnifications are shown for each condition.
FIG. 5.
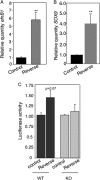
Reverse signaling regulates the expression of miR-124 target genes. (A) Wild-type NPCs were stimulated with Fc (control) or EphB2-Fc (reverse), and EfnB1 levels were determined by qRT-PCR. (B) Wild-type NPCs were stimulated with Fc (control) or EphB2-Fc (reverse), and Sox9 levels were determined by qRT-PCR. (C) Normalized luciferase activity in wild-type (WT) and _EfnB1_-deficient (KO) NPCs electroporated with the T1 reporter and stimulated with Fc (control) or EphB2-Fc (reverse). Results are the means ± standard errors from 3 independent experiments, each measured in duplicate. **, P < 0.01.
FIG. 6.
Increased neuronal differentiation in _EfnB1_-deficient NPCs correlates with elevated miR-124 levels. (A) NPCs were cultured on poly-
l
-lysine-coated plates and were allowed to differentiate for 3 or 6 days. Levels of miR-124 and EfnB1 were measured by qPCR and qRT-PCR, respectively, and are expressed as percentages of the day 0 levels. Results are the means ± standard errors (SE) from 3 independent experiments. (B) tubb3 levels in differentiated wild-type (WT) or _EfnB1_−/− (KO) NPCs were determined by qRT-PCR. (C) Spontaneous neuronal differentiation in growing wild-type (WT) and _EfnB1_−/− (KO) NPCs was assessed by FACS analysis using βIII-tubulin as a marker. FL1-H and FL4-H, heights of fluorescence intensity in channels 1 and 4, respectively. (D) Growing _EfnB1_−/− NPCs were electroporated with scrambled LNA or LNA-124, and gfap and tubb3 levels were determined by qRT-PCR. Results are the means ± SE from 3 independent experiments, each measured in duplicate. *, P < 0.05; **, P < 0.01.
FIG. 7.
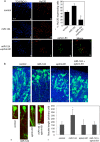
Downregulation of ephrin-B1 is required for miR-124-induced neuronal differentiation. (A) NPCs were electroporated with a control (a and b) or a miR-124 (c and d) or miR-124+ephrin-B1-GFP (e to h) expression construct, differentiated for 6 days, and stained with HuC/D antibody (b, d, f, and h). Ephrin-B1 expression was detected by epifluorescence (g and h). Images are representative of three separate experiments. Quantification of HuC/D-expressing cells under the three conditions listed above is also shown (i). (B) E14.5 developing cortices were coelectroporated with a GFP reporter plasmid and with the scrambled oligonucleotide (a), miR-124 (b), ephrin-B1-GFP (c), or miR-124+ephrin-B1-GFP (d) expression construct and cultured for 16 h. Images show nuclei in blue and GFP-positive neurons in green. A high magnification of single cells electroporated with the scrambled oligonucleotide, miR-124, ephrin-B1-GFP, or miR-124+ephrin-B1-GFP expression construct is also shown (e), as is the quantification of neurite length of GFP-positive neurons in the CP (f). Images and quantification results are representative of 3 independent electroporated brains. *, P < 0.05.
Similar articles
- The impact of CFNS-causing EFNB1 mutations on ephrin-B1 function.
Makarov R, Steiner B, Gucev Z, Tasic V, Wieacker P, Wieland I. Makarov R, et al. BMC Med Genet. 2010 Jun 17;11:98. doi: 10.1186/1471-2350-11-98. BMC Med Genet. 2010. PMID: 20565770 Free PMC article. - Eph:ephrin-B1 forward signaling controls fasciculation of sensory and motor axons.
Luxey M, Jungas T, Laussu J, Audouard C, Garces A, Davy A. Luxey M, et al. Dev Biol. 2013 Nov 15;383(2):264-74. doi: 10.1016/j.ydbio.2013.09.010. Epub 2013 Sep 19. Dev Biol. 2013. PMID: 24056079 - Disruption of ephrin B/Eph B interaction results in abnormal cochlear innervation patterns.
Zhou CQ, Lee J, Henkemeyer MJ, Lee KH. Zhou CQ, et al. Laryngoscope. 2011 Jul;121(7):1541-7. doi: 10.1002/lary.21861. Epub 2011 Jun 6. Laryngoscope. 2011. PMID: 21647913 - Control of cell behaviour by signalling through Eph receptors and ephrins.
Mellitzer G, Xu Q, Wilkinson DG. Mellitzer G, et al. Curr Opin Neurobiol. 2000 Jun;10(3):400-8. doi: 10.1016/s0959-4388(00)00095-7. Curr Opin Neurobiol. 2000. PMID: 10851175 Review. - Regulation of the MIR155 host gene in physiological and pathological processes.
Elton TS, Selemon H, Elton SM, Parinandi NL. Elton TS, et al. Gene. 2013 Dec 10;532(1):1-12. doi: 10.1016/j.gene.2012.12.009. Epub 2012 Dec 14. Gene. 2013. PMID: 23246696 Review.
Cited by
- Regulation of cell differentiation by Eph receptor and ephrin signaling.
Wilkinson DG. Wilkinson DG. Cell Adh Migr. 2014;8(4):339-48. doi: 10.4161/19336918.2014.970007. Cell Adh Migr. 2014. PMID: 25482623 Free PMC article. Review. - Pri-microRNA-124 rs531564 polymorphism minor allele increases the risk of pulmonary artery hypertension by abnormally enhancing proliferation of pulmonary artery smooth muscle cells.
Li Q, Qian Z, Wang L. Li Q, et al. Int J Chron Obstruct Pulmon Dis. 2017 May 4;12:1351-1361. doi: 10.2147/COPD.S99318. eCollection 2017. Int J Chron Obstruct Pulmon Dis. 2017. PMID: 28496318 Free PMC article. - MicroRNAs shape the neuronal landscape.
McNeill E, Van Vactor D. McNeill E, et al. Neuron. 2012 Aug 9;75(3):363-79. doi: 10.1016/j.neuron.2012.07.005. Neuron. 2012. PMID: 22884321 Free PMC article. Review. - Ephrin-B2 paces neuronal production in the developing neocortex.
Kischel A, Audouard C, Fawal MA, Davy A. Kischel A, et al. BMC Dev Biol. 2020 May 13;20(1):12. doi: 10.1186/s12861-020-00215-3. BMC Dev Biol. 2020. PMID: 32404061 Free PMC article. - An updated role of microRNA-124 in central nervous system disorders: a review.
Sun Y, Luo ZM, Guo XM, Su DF, Liu X. Sun Y, et al. Front Cell Neurosci. 2015 May 20;9:193. doi: 10.3389/fncel.2015.00193. eCollection 2015. Front Cell Neurosci. 2015. PMID: 26041995 Free PMC article. Review.
References
- Campbell, T. N., A. Davy, Y. Liu, M. Arcellana-Panlilio, and S. M. Robbins. 2008. Distinct membrane compartmentalization and signaling of ephrin-A5 and ephrin-B1. Biochem. Biophys. Res. Commun. 375:362-366. - PubMed
- Campbell, T. N., and S. M. Robbins. 2008. The Eph receptor/ephrin system: an emerging player in the invasion game. Curr. Issues Mol. Biol. 10:61-66. - PubMed
Publication types
MeSH terms
Substances
LinkOut - more resources
Full Text Sources
Molecular Biology Databases
Miscellaneous


