Fat cell-specific ablation of rictor in mice impairs insulin-regulated fat cell and whole-body glucose and lipid metabolism - PubMed (original) (raw)
. 2010 Jun;59(6):1397-406.
doi: 10.2337/db09-1061. Epub 2010 Mar 23.
Affiliations
- PMID: 20332342
- PMCID: PMC2874700
- DOI: 10.2337/db09-1061
Fat cell-specific ablation of rictor in mice impairs insulin-regulated fat cell and whole-body glucose and lipid metabolism
Anil Kumar et al. Diabetes. 2010 Jun.
Abstract
Objective: Rictor is an essential component of mammalian target of rapamycin (mTOR) complex (mTORC) 2, a kinase that phosphorylates and activates Akt, an insulin signaling intermediary that regulates glucose and lipid metabolism in adipose tissue, skeletal muscle, and liver. To determine the physiological role of rictor/mTORC2 in insulin signaling and action in fat cells, we developed fat cell-specific rictor knockout (FRic(-/-)) mice.
Research design and methods: Insulin signaling and glucose and lipid metabolism were studied in FRic(-/-) fat cells. In vivo glucose metabolism was evaluated by hyperinsulinemic-euglycemic clamp.
Results: Loss of rictor in fat cells prevents insulin-stimulated phosphorylation of Akt at S473, which, in turn, impairs the phosphorylation of downstream targets such as FoxO3a at T32 and AS160 at T642. However, glycogen synthase kinase-3beta phosphorylation at S9 is not affected. The signaling defects in FRic(-/-) fat cells lead to impaired insulin-stimulated GLUT4 translocation to the plasma membrane and decreased glucose transport. Furthermore, rictor-null fat cells are unable to suppress lipolysis in response to insulin, leading to elevated circulating free fatty acids and glycerol. These metabolic perturbations are likely to account for defects observed at the whole-body level of FRic(-/-) mice, including glucose intolerance, marked hyperinsulinemia, insulin resistance in skeletal muscle and liver, and hepatic steatosis.
Conclusions: Rictor/mTORC2 in fat cells plays an important role in whole-body energy homeostasis by mediating signaling necessary for the regulation of glucose and lipid metabolism in fat cells.
Figures
FIG. 1.
Analysis of rictor expression and insulin signaling in FRic−/− fat cells. A: Lack of rictor protein in FRic−/− fat cells. Tissue extracts prepared from isolated fat cells, liver, and skeletal muscle were subjected to SDS-PAGE (6.5% gel) and immunoblotted with anti-rictor antibody (top). The immunoblots for mTOR, Akt, and actin (loading control) are shown in the bottom panels. B: Insulin signaling in isolated FRic−/− fat cells. Immunoblot analysis of insulin (ins)-stimulated phosphorylation of Akt at S473, Akt at T308, IR at Y972, FoxO3A at T32, GSK-3β at S9, and AS160 at T642 in FRic−/− and FRic+/+ fat cells (shown here are representative immunoblots, four mice for each genotype were analyzed). Also shown are immunoblots of total Akt, FoxO3A, GSK-3β, and AS160 used for normalizing the corresponding anti-phospho immunoblots.
FIG. 2.
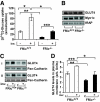
Glucose uptake in FRic−/− fat cells. A: [U14C]-glucose uptake in fat cells isolated from FRic+/+ and FRic−/− mice (3- to 5-month-old female mice, n = 4, *P < 0.004; **P < 0.0002; ***P < 0.0001). B: Representative immunoblots of isolated FRic−/− and FRic+/+ fat cell extracts from 3- to 5-month-old female mice, probed for GLUT4, Myo1c, and IRAP (n = 5). C: Immunoblots showing GLUT4 levels in plasma membrane isolated from basal and insulin-stimulated fat pads from FRic−/− and FRic+/+ mice (3- to 5-month-old female, representative blots of two sets of FRic+/+ and FRic−/− fat pads labeled as I and II out of a total of three sets). Cadherin levels in plasma membrane determined by immunoblotting with pan-cadherin antibody served as the loading control for plasma membrane preparations (middle panel). D: The GLUT4 quantification data (means ± SE) shows band intensity of GLUT4 after normalization to the levels of cadherin detected in the same sample (n = 3, *P < 0.05; **P < 0.01 and ***P < 0.006). arb., arbitrary. ins, insulin.
FIG. 3.
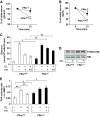
Resistance to insulin-mediated inhibition of lipolysis in FRic−/− mice. A and B: Insulin-mediated inhibition of lipolysis was determined by measuring the levels of glycerol (shown in A, n = 8, *P < 0.002) and NEFAs (shown in B, n = 5–8, *P < 0.004) in serum before and 15 min after an intraperitoneal injection of insulin in FRic+/+ and FRic−/− mice. Data shown are means ± SE. C: Lipolysis was determined ex vivo in fat cells isolated from FRic−/− and FRic+/+ mice (3- to 5-month-old female mice, n = 4, *P < 0.01; **P < 0.001) in the absence or presence of CL316243 (CL, 1 nmol/l) without and with insulin (1 and 10 nmol/l) for 30 min and measuring glycerol released into the medium. D: Phosphorylation of HSL at S563 in basal and insulin-stimulated fat pads from FRic−/− and FRic+/+ mice (representative immunoblots are shown, n = 3). E: PKA activity in FRic−/− and FRic+/+ fat cells incubated in the absence or presence of CL316243 (CL, 1 nmol/l) without and with insulin (1 nmol/l) for 10 min (n = 4, *P < 0.04; **P < 0.001). ins, insulin.
FIG. 4.
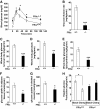
Glucose homeostasis in male FRic−/− mice. A: Intraperitoneal glucose tolerance tests in old male FRic−/− and FRic+/+ mice (>9 months old, n = 4, *P < 0.05). B–F: Whole-body glucose homeostasis in young FRic−/− and FRic+/+ mice as evaluated by hyperinsulinemic-euglycemic clamp. B: Glucose infusion rate. C: Glucose turnover rate. D: Glycolysis. E: Glycogen plus lipid synthesis. F: Glucose uptake in adipose tissue. G: glucose uptake in skeletal muscle. H: hepatic glucose production (3- to 4-month-old male mice, n = 5–6 per group. B–H: *P < 0.04; **P < 0.001; ***P < 0.0001). Data shown are means ± SE.
FIG. 5.
Glucose and lipid metabolism and insulin signaling in skeletal muscles from FRic−/− mice. A: Insulin-stimulated glycogen synthesis in ex vivo–incubated soleus muscles (female, 3–5 months old, n = 4–5, *P < 0.02; **P < 0.0001) from FRic−/−mice using [U14C]-glucose. B: Insulin signaling in isolated EDL muscles from FRic+/+ and FRic−/− mice. Protein extracts prepared from EDL muscles stimulated without or with 20 mU of insulin for 30 min were immunoblotted with phospho-specific antibodies to the Y-972 residue of IR, the Y896 residue of IRS1, and the T308 and S473 residues of Akt (representative blot is shown, n = 3–4). C: In vivo total and phosphorylated IRS1 at S302. Protein extracts prepared from TA muscles of fed FRic+/+ and FRic−/− mice were immunoblotted using antibodies against phospho-S302 IRS1 (P-S302 IRS1), total IRS1, and actin (female, 3–5 months old, representative blots of two sets of FRic+/+ and FRic−/− mice labeled as I and II out of a total of eight sets). D: Triglyceride levels in skeletal muscle homogenates prepared from fed FRic+/+ and FRic−/− mice (3- to 5-month-old female, n = 5–6, *P < 0.04). Data shown are means ± SE. E: Protein extracts prepared from TA muscles of fed FRic+/+ and FRic−/− mice were immunoblotted for lipin1 and actin (3- to 5-month-old female mice, representative blots of two sets of FRic+/+ and FRic−/− mice labeled as I and II out of a total of eight sets). ins, insulin.
FIG. 6.
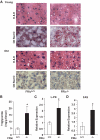
Hepatic steatosis in FRic−/− mice. A: Histochemical analysis of FRic−/− and FRic+/+ liver for hepatic steatosis. A: Young (2–5 months old) and old (>9 months old) female FRic+/+ or FRic−/− mice liver sections stained with hematoxylin and eosin (H & E) (_upper panel_s), or oil red O (_lower panel_s) (representative images are shown out of four to five for each age-group). B: Triglyceride concentration in liver homogenates of FRic+/+ and FRic−/− mice (>6-month-old female, n = 8–9, *P < 0.01). C and D: Lipogenic gene expression in liver normalized to GAPDH. C:
l
-type pyruvate kinase gene expression (>6-month-old male mice, n = 5, *P < 0.03). _D_: FAS gene expression (>6-month-old male mice, n = 5, *P < 0.02). Data shown are means ± SE. (A high-quality digital representation of this figure is available in the online issue.)
Comment in
Similar articles
- Muscle-specific deletion of rictor impairs insulin-stimulated glucose transport and enhances Basal glycogen synthase activity.
Kumar A, Harris TE, Keller SR, Choi KM, Magnuson MA, Lawrence JC Jr. Kumar A, et al. Mol Cell Biol. 2008 Jan;28(1):61-70. doi: 10.1128/MCB.01405-07. Epub 2007 Oct 29. Mol Cell Biol. 2008. PMID: 17967879 Free PMC article. - Insulin resistance in striated muscle-specific integrin receptor beta1-deficient mice.
Zong H, Bastie CC, Xu J, Fassler R, Campbell KP, Kurland IJ, Pessin JE. Zong H, et al. J Biol Chem. 2009 Feb 13;284(7):4679-88. doi: 10.1074/jbc.M807408200. Epub 2008 Dec 8. J Biol Chem. 2009. PMID: 19064993 Free PMC article. - Regulatory role for the arginine-nitric oxide pathway in metabolism of energy substrates.
Jobgen WS, Fried SK, Fu WJ, Meininger CJ, Wu G. Jobgen WS, et al. J Nutr Biochem. 2006 Sep;17(9):571-88. doi: 10.1016/j.jnutbio.2005.12.001. Epub 2006 Jan 9. J Nutr Biochem. 2006. PMID: 16524713 Review.
Cited by
- The multifaceted role of mTORC1 in the control of lipid metabolism.
Ricoult SJ, Manning BD. Ricoult SJ, et al. EMBO Rep. 2013 Mar 1;14(3):242-51. doi: 10.1038/embor.2013.5. Epub 2012 Feb 12. EMBO Rep. 2013. PMID: 23399656 Free PMC article. Review. - The suppression of hepatic glucose production improves metabolism and insulin sensitivity in subcutaneous adipose tissue in mice.
Casteras S, Abdul-Wahed A, Soty M, Vulin F, Guillou H, Campana M, Le Stunff H, Pirola L, Rajas F, Mithieux G, Gautier-Stein A. Casteras S, et al. Diabetologia. 2016 Dec;59(12):2645-2653. doi: 10.1007/s00125-016-4097-y. Epub 2016 Sep 9. Diabetologia. 2016. PMID: 27631137 - The role of GH in adipose tissue: lessons from adipose-specific GH receptor gene-disrupted mice.
List EO, Berryman DE, Funk K, Gosney ES, Jara A, Kelder B, Wang X, Kutz L, Troike K, Lozier N, Mikula V, Lubbers ER, Zhang H, Vesel C, Junnila RK, Frank SJ, Masternak MM, Bartke A, Kopchick JJ. List EO, et al. Mol Endocrinol. 2013 Mar;27(3):524-35. doi: 10.1210/me.2012-1330. Epub 2013 Jan 24. Mol Endocrinol. 2013. PMID: 23349524 Free PMC article. - Rapamycin-induced insulin resistance is mediated by mTORC2 loss and uncoupled from longevity.
Lamming DW, Ye L, Katajisto P, Goncalves MD, Saitoh M, Stevens DM, Davis JG, Salmon AB, Richardson A, Ahima RS, Guertin DA, Sabatini DM, Baur JA. Lamming DW, et al. Science. 2012 Mar 30;335(6076):1638-43. doi: 10.1126/science.1215135. Science. 2012. PMID: 22461615 Free PMC article. - A novel rapamycin analog is highly selective for mTORC1 in vivo.
Schreiber KH, Arriola Apelo SI, Yu D, Brinkman JA, Velarde MC, Syed FA, Liao CY, Baar EL, Carbajal KA, Sherman DS, Ortiz D, Brunauer R, Yang SE, Tzannis ST, Kennedy BK, Lamming DW. Schreiber KH, et al. Nat Commun. 2019 Jul 19;10(1):3194. doi: 10.1038/s41467-019-11174-0. Nat Commun. 2019. PMID: 31324799 Free PMC article.
References
- Wullschleger S, Loewith R, Hall MN: TOR signaling in growth and metabolism. Cell 2006; 124: 471–484 - PubMed
- Jacinto E, Loewith R, Schmidt A, Lin S, Ruegg MA, Hall A, Hall MN: Mammalian TOR complex 2 controls the actin cytoskeleton and is rapamycin insensitive. Nat Cell Biol 2004; 6: 1122–1128 - PubMed
- Vander HE, Lee SI, Bandhakavi S, Griffin TJ, Kim DH: Insulin signalling to mTOR mediated by the Akt/PKB substrate PRAS40. Nat Cell Biol 2007; 9: 316–323 - PubMed
- Sarbassov DD, Ali SM, Sengupta S, Sheen JH, Hsu PP, Bagley AF, Markhard AL, Sabatini DM: Prolonged rapamycin treatment inhibits mTORC2 assembly and Akt/PKB. Mol Cell 2006; 22: 159–168 - PubMed
- Hay N, Sonenberg N: Upstream and downstream of mTOR. Genes Dev 2004; 18: 1926–1945 - PubMed
Publication types
MeSH terms
Substances
Grants and funding
- DK52753/DK/NIDDK NIH HHS/United States
- P30 DK032520/DK/NIDDK NIH HHS/United States
- DK32520/DK/NIDDK NIH HHS/United States
- R01 DK028312/DK/NIDDK NIH HHS/United States
- DK28312/DK/NIDDK NIH HHS/United States
- R01 DK052753/DK/NIDDK NIH HHS/United States
- R01 DK080756/DK/NIDDK NIH HHS/United States
- DK80756/DK/NIDDK NIH HHS/United States
LinkOut - more resources
Full Text Sources
Other Literature Sources
Medical
Molecular Biology Databases
Research Materials
Miscellaneous


