Fast photochemical oxidation of protein footprints faster than protein unfolding - PubMed (original) (raw)
Fast photochemical oxidation of protein footprints faster than protein unfolding
Brian C Gau et al. Anal Chem. 2009.
Abstract
Fast photochemical oxidation of proteins (FPOP) is a chemical footprinting method whereby exposed amino-acid residues are covalently labeled by oxidation with hydroxyl radicals produced by the photolysis of hydrogen peroxide. Modified residues can be detected by standard trypsin proteolysis followed by LC/MS/MS, providing information about solvent accessibility at the peptide and even the amino-acid level. Like other chemical footprinting techniques, FPOP must ensure only the native conformation is labeled. Although oxidation via hydroxyl radical induces unfolding in proteins on a time scale of milliseconds or longer, FPOP is designed to limit (*)OH exposure to 1 micros or less by employing a pulsed laser for initiation to produce the radicals and a radical-scavenger to limit their lifetimes. We applied FPOP to three oxidation-sensitive proteins and found that the distribution of modification (oxidation) states is Poisson when a scavenger is present, consistent with a single conformation protein modification model. This model breaks down when a scavenger is not used and/or hydrogen peroxide is not removed following photolysis. The outcome verifies that FPOP occurs on a time scale faster than conformational changes in these proteins.
Figures
Figure 1
Schematic of FPOP whereby a protein in a solution flowing in fused silica reacts with OH radicals. Shown is the reaction region with typical flow rate, laser pulse frequency, and laser spot size.
Figure 2
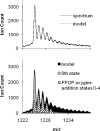
Graph (a) is of the ESI-QTOF mass spectrum of the 15th charge state of FPOP-treated β-lactoglobulin and its composite model. Graph (b) is of the background-subtracted model and its first five oxygen-addition state components (hashed fill). The 0th state (gray) is made up of a 53% contribution from the exclusion volume fraction (not shown) and a 47% contribution from the irradiated portion of the sample that did not react with OH radicals.
Figure 3
ESI-QTOF mass spectra of the 15th charge state of six β-lactoglobulin samples subjected to varying FPOP conditions. Spectrum (a) is of the control, absent only laser irradiation; (b) is of a normal FPOP treatment with an EVF 60%; (c) is of a normal treatment with an EVF 30%; (d–f) are of samples with an EVF of 15%; (d) is of a normal treatment (all controls); (e) is of a treatment absent 20 mM Gln; and (f) is of a treatment without use of scavenger (Gln), removal of peroxide (by catalase), and control of post FPOP oxidation (addition of Met).
Figure 4
ESI-QTOF mass spectra (a–c) are of the 15th charge state apo-calmodulin; spectra (e–g) are of the 10th charge state of lysozyme. Spectra (a) and (d) are of the controls, absent only laser irradiation; (b) and (e) are of samples after normal FPOP treatment (i.e., with scavenger and removal of peroxide post FPOP); (c) and (f) are of samples after FPOP treatment absent the scavenger (20 mM Gln).
Figure 5
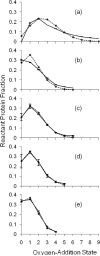
The irradiation volume oxygen-addition state ion counts are modeled for the spectrum of each bovine β-lactoglobulin sample. The modeling was constrained such that the calculated EVF matched the independently measured EVF. Per condition, shown with standard error bars along a solid line, are the averages of the normalized ion counts of four replicates (a–c) and two replicates (d–e). The diamonds along a dotted line show the non-linear regression best-fit Poisson distribution to the average oxygen-addition state distribution. The number of states per sample distribution fit to a Poisson was chosen to account for at least 95% of protein signal. Plot (a) is for sample submitted to FPOP but without the glutamine radical scavenger. When all zero oxygen-addition protein is assigned to the EVF, its value is 9%, short of the measured 15%. Plot (b) is for sample submitted to FPOP but without removal of peroxide post-FPOP, with a 15% EVF. Plot (c) is for sample FPOP-treated with a 15% EVF. Plot (d) is for sample FPOP-treated with a 30% EVF. Plot (e) is for sample FPOP-treated with a 60% EVF.
Figure 6
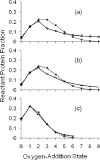
The irradiation volume oxygen-addition state ion counts are modeled for the spectrum of each β-lactoglobulin sample. A non-linear regression best fit Poisson distribution was simultaneously determined; the EVF was varied to optimize the fit. Per condition, shown with standard error bars along a solid line, are the averages of the normalized ion counts of 4 replicates (b and c); case (a) is singlicate. The number of states per sample distribution plotted account for at least 95% of protein signal. The diamonds along a dotted line show the Poisson distribution. Plot (a) is for sample FPOP-treated without glutamine radical scavenger, post-FPOP catalase, or post-FPOP methionine. The best fit exclusion volume was calculated at 6.6%. Plot (b) is for sample FPOP-treated without glutamine, with a calculated EVF of 7.0 ± 0.4%. Plot (c) is for sample FPOP-treated with a calculated EVF of 17 ± 2%. In all cases the measured EVF was 15%.
Similar articles
- Mass Spectrometry-Based Fast Photochemical Oxidation of Proteins (FPOP) for Higher Order Structure Characterization.
Li KS, Shi L, Gross ML. Li KS, et al. Acc Chem Res. 2018 Mar 20;51(3):736-744. doi: 10.1021/acs.accounts.7b00593. Epub 2018 Feb 16. Acc Chem Res. 2018. PMID: 29450991 Free PMC article. Review. - Modifications generated by fast photochemical oxidation of proteins reflect the native conformations of proteins.
Chea EE, Jones LM. Chea EE, et al. Protein Sci. 2018 Jun;27(6):1047-1056. doi: 10.1002/pro.3408. Epub 2018 Apr 14. Protein Sci. 2018. PMID: 29575296 Free PMC article. - Protein higher-order-structure determination by fast photochemical oxidation of proteins and mass spectrometry analysis.
Liu XR, Rempel DL, Gross ML. Liu XR, et al. Nat Protoc. 2020 Dec;15(12):3942-3970. doi: 10.1038/s41596-020-0396-3. Epub 2020 Nov 9. Nat Protoc. 2020. PMID: 33169002 Free PMC article. - Fast photochemical oxidation of proteins coupled with mass spectrometry.
Cornwell O, Ault JR. Cornwell O, et al. Biochim Biophys Acta Proteins Proteom. 2022 Sep 1;1870(9):140829. doi: 10.1016/j.bbapap.2022.140829. Epub 2022 Aug 4. Biochim Biophys Acta Proteins Proteom. 2022. PMID: 35933084 Review. - Fast Photochemical Oxidation of Proteins Coupled with Mass Spectrometry.
Shi L, Gross ML. Shi L, et al. Protein Pept Lett. 2019;26(1):27-34. doi: 10.2174/0929866526666181128124554. Protein Pept Lett. 2019. PMID: 30484399 Free PMC article. Review.
Cited by
- Supercharging by m-NBA Improves ETD-Based Quantification of Hydroxyl Radical Protein Footprinting.
Li X, Li Z, Xie B, Sharp JS. Li X, et al. J Am Soc Mass Spectrom. 2015 Aug;26(8):1424-7. doi: 10.1007/s13361-015-1129-7. Epub 2015 Apr 28. J Am Soc Mass Spectrom. 2015. PMID: 25916598 Free PMC article. - Chemokine oligomerization in cell signaling and migration.
Wang X, Sharp JS, Handel TM, Prestegard JH. Wang X, et al. Prog Mol Biol Transl Sci. 2013;117:531-78. doi: 10.1016/B978-0-12-386931-9.00020-9. Prog Mol Biol Transl Sci. 2013. PMID: 23663982 Free PMC article. Review. - Complementary MS methods assist conformational characterization of antibodies with altered S-S bonding networks.
Jones LM, Zhang H, Cui W, Kumar S, Sperry JB, Carroll JA, Gross ML. Jones LM, et al. J Am Soc Mass Spectrom. 2013 Jun;24(6):835-45. doi: 10.1007/s13361-013-0582-4. Epub 2013 Mar 13. J Am Soc Mass Spectrom. 2013. PMID: 23483515 Free PMC article. - Higher-Order Structure Influences the Kinetics of Diethylpyrocarbonate Covalent Labeling of Proteins.
Pan X, Limpikirati P, Chen H, Liu T, Vachet RW. Pan X, et al. J Am Soc Mass Spectrom. 2020 Mar 4;31(3):658-665. doi: 10.1021/jasms.9b00132. Epub 2020 Jan 27. J Am Soc Mass Spectrom. 2020. PMID: 32013423 Free PMC article. - Covalent labeling with isotopically encoded reagents for faster structural analysis of proteins by mass spectrometry.
Zhou Y, Vachet RW. Zhou Y, et al. Anal Chem. 2013 Oct 15;85(20):9664-70. doi: 10.1021/ac401978w. Epub 2013 Sep 23. Anal Chem. 2013. PMID: 24010814 Free PMC article.
References
- Hirs CHW, Di Sabato G, Ottesen M, Gold AM, Gurd FRN, Horton HR, Koshland DE, Kimmel JR, Klotz IM, Ludwig ML, Hunter MJ, Neumann NP, Ray WJ, Riordan JF, Vallee BL, Sela M, Arnon R, Spande TF, Witkop B, Stark GR, Wilcox PE, Wold F. Methods in Enzymology. Vol. 11. Academic Press; 1967. pp. 485–748.
- Fenn JB, Mann M, Meng CK, Wong SF, Whitehouse CM. Science. 1989;246:64–71. - PubMed
- Karas M, Bachmann D, Hillenkamp F. Anal. Chem. 1985;57:2935–2939.
- Lars Konermann XTYP. J. Mass Spectrom. 2008;43:1021–1036. - PubMed
- Xu G, Chance MR. Anal. Chem. 2004;76:1213–1221. - PubMed
MeSH terms
Substances
Grants and funding
- P41 GM103390/GM/NIGMS NIH HHS/United States
- P41 GM103422/GM/NIGMS NIH HHS/United States
- P41 RR000954/RR/NCRR NIH HHS/United States
- P41 RR005351/RR/NCRR NIH HHS/United States
LinkOut - more resources
Full Text Sources
Other Literature Sources


