Dissecting interferon-induced transcriptional programs in human peripheral blood cells - PubMed (original) (raw)
Dissecting interferon-induced transcriptional programs in human peripheral blood cells
Simon J Waddell et al. PLoS One. 2010.
Abstract
Interferons are key modulators of the immune system, and are central to the control of many diseases. The response of immune cells to stimuli in complex populations is the product of direct and indirect effects, and of homotypic and heterotypic cell interactions. Dissecting the global transcriptional profiles of immune cell populations may provide insights into this regulatory interplay. The host transcriptional response may also be useful in discriminating between disease states, and in understanding pathophysiology. The transcriptional programs of cell populations in health therefore provide a paradigm for deconvoluting disease-associated gene expression profiles.We used human cDNA microarrays to (1) compare the gene expression programs in human peripheral blood mononuclear cells (PBMCs) elicited by 6 major mediators of the immune response: interferons alpha, beta, omega and gamma, IL12 and TNFalpha; and (2) characterize the transcriptional responses of purified immune cell populations (CD4+ and CD8+ T cells, B cells, NK cells and monocytes) to IFNgamma stimulation. We defined a highly stereotyped response to type I interferons, while responses to IFNgamma and IL12 were largely restricted to a subset of type I interferon-inducible genes. TNFalpha stimulation resulted in a distinct pattern of gene expression. Cell type-specific transcriptional programs were identified, highlighting the pronounced response of monocytes to IFNgamma, and emergent properties associated with IFN-mediated activation of mixed cell populations. This information provides a detailed view of cellular activation by immune mediators, and contributes an interpretive framework for the definition of host immune responses in a variety of disease settings.
Conflict of interest statement
Competing Interests: The authors have declared that no competing interests exist.
Figures
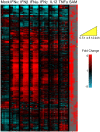
Figure 1. PBMC transcriptional programs elicited by cytokine exposure.
The PBMC response to stimulation with 0.6 pM IFNα, β, ω, γ, IL12 and TNFα from 30 minutes to 24 h after treatment. 1857 genes were identified to be significantly differentially expressed in response to one or more stimuli compared to mock-treated PBMC (0.1% BSA/PBS). The expression profiles are ordered by hierarchical clustering; the genes are displayed as rows, time points/conditions as columns, in temporal order (see yellow key). Red coloring signifies the up-regulation of expression; blue coloring denotes down-regulation. Samples were taken at time intervals of 0.5, 1, 4, 8, 12 and 24 h. The column marked SAM indicates (in red) which genes were identified to be significantly differentially expressed in response to each cytokine.
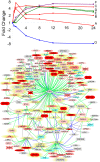
Figure 2. Induction of IFNγ in PBMCs after IL12 exposure.
The mean expression profile of IFNγ transcripts after exposure of PBMCs to 0.6 pM IFNα, β, ω, and γ, IL12 and TNFα; as determined by microarray analysis at time intervals of 0.5, 1, 4, 8, 12 and 24 h post stimulation. Standard deviations are indicated with error bars.
Figure 3. Cell-type associated gene expression.
A (left). Cell type-associated genes identified from the transcriptional profiles of unstimulated isolated cell types (time zero and 0.1% BSA/PBS-treated time series). Genes were defined as cell type-associated if they were identified as significantly more highly expressed in a single cell type compared to all other cell types. The expression profiles are ordered by hierarchical clustering; the genes are displayed as rows, cell type/time points as columns. Red coloring signifies high expression; blue coloring denotes low expression. Cell type-associated gene clusters are marked. B (right). The cell type-specific nature of IFNγ transcriptional responses. Purified subsets of B cells, CD4+ T cells, CD8+ T cells, NK cells and monocytes were stimulated with 0.6 pM IFNγ and sampled at 0.5, 1, 4, 8, 12 and 24 h. 807 significantly induced genes were identified, and ordered by cell type and hierarchical clustering. The genes are displayed as rows, time points/cell subsets as columns. Red coloring signifies up-regulation, and blue coloring signifies down-regulation of expression after IFNγ exposure relative to the mock-treated discrete cell population. The column marked SAM indicates (in red) which genes were significantly differentially expressed by IFNγ in each cell type. Genes of interest are marked as annotated in Source .
Figure 4. Monocyte responses to IFNγ.
A (top). The temporal transcriptional responses of monocytes to IFNγ stimulation. Of 363 genes that were significantly differentially expressed following treatment with 0.6 pM IFNγ, 264 genes were assigned to 7 significantly represented expression profiles, A–G. The temporal response (measured in mean fold change) of the genes assigned to each cluster is plotted at 0.5, 1, 4, 8, 12 and 24 h post treatment. Clusters A (square), B (triangle) and C (diamond) colored red; D (triangle) and E (square) in green; F (square) in purple; and G (square) in blue. B (bottom). A network of predicted crosstalk downstream of IFNγ exposure. Previously characterized interactions between IFNγ and the 363 genes identified as differentially expressed after IFNγ treatment in monocytes were mapped. The expression of 109 genes were predicted to be directly affected by IFNγ. Secondary regulatory events were characterized by the expression of 65 additional genes (identified to be differentially expressed by IFNγ treatment) whose expression was modified by those 109 genes but not by IFNγ directly. This network illustrates the complexity of possible interplay downstream of IFNγ stimulation. In addition, 61 proteins reported to have an effect on IFNγ expression itself are highlighted in yellow, and may represent positive and negative feedback loops mediating cell activation. Gene identifiers are colored by temporal expression pattern after IFNγ treatment as detailed in Figure 4A (dark red (profiles A–C), lighter red (D and E), pink (F), blue (G), grey (unassigned)). Gene identifiers are also shaped by putative function, transcription factors (ellipse), kinase/phosphatases (triangle), ligands (rhombus), receptors (cross). The nature of the interactions are indicated with connecting lines either reflecting a positive (green), negative (blue), or undefined (grey) impact on downstream gene or protein expression.
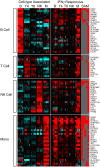
Figure 5. The transcriptional plasticity of immune cellular responses to IFNγ stimulation.
79 genes associated with a single isolated immune cell subtype (without stimulation) were induced after IFNγ treatment in other cell types. Genes defined as cell type-associated (by comparing unstimulated time series, as detailed in Figure 3A) are marked on the left. The top panel detailing B cell associated genes, followed by T cell, NK cell, and monocyte associated genes illustrated in the bottom panel. The differential regulation of these genes after IFNγ treatment in each cell type (as in Figure 3B) is described on the right. The expression profiles are ordered by hierarchical clustering; the genes are displayed as rows, cell type/time points as columns. Red coloring in the cell-type associated panels (on left) signifies highly expressed in a single cell type compared to all other cell types; blue coloring denotes low expression. Red coloring in the IFNγ responsive panels (on right) signifies up-regulation, and blue coloring signifies down-regulation of expression after IFNγ exposure relative to the mock-treated discrete cell population. B (B cells); T4 (CD4+ T cells); T8 (CD8+ T cells); NK (NK cells); M (monocytes). The column marked SAM details (in red) which genes were significantly differentially expressed by IFNγ in each cell type. Genes are marked as annotated in Source .
Similar articles
- The multifaceted balance of TNF-α and type I/II interferon responses in SLE and RA: how monocytes manage the impact of cytokines.
Smiljanovic B, Grün JR, Biesen R, Schulte-Wrede U, Baumgrass R, Stuhlmüller B, Maslinski W, Hiepe F, Burmester GR, Radbruch A, Häupl T, Grützkau A. Smiljanovic B, et al. J Mol Med (Berl). 2012 Nov;90(11):1295-309. doi: 10.1007/s00109-012-0907-y. Epub 2012 May 19. J Mol Med (Berl). 2012. PMID: 22610275 - Interferon signals and monocytic sensitization of the interferon-γ signaling pathway in the peripheral blood of patients with rheumatoid arthritis.
Karonitsch T, von Dalwigk K, Steiner CW, Blüml S, Steiner G, Kiener HP, Smolen JS, Aringer M. Karonitsch T, et al. Arthritis Rheum. 2012 Feb;64(2):400-8. doi: 10.1002/art.33347. Arthritis Rheum. 2012. PMID: 21953607 - [The regulatory function of tumor-infiltrating Th9 cells to anti-tumor activity of CD8(+) T cells in patients with gastric cancer].
Sun PS, Gao ZJ, Fan LX, Liu YF, Chen BH, Mu SZ, Yan ZQ. Sun PS, et al. Zhonghua Zhong Liu Za Zhi. 2022 Nov 23;44(11):1186-1193. doi: 10.3760/cma.j.cn112152-20200530-00499. Zhonghua Zhong Liu Za Zhi. 2022. PMID: 36380667 Chinese. - Cellular responses to interferon-gamma.
Boehm U, Klamp T, Groot M, Howard JC. Boehm U, et al. Annu Rev Immunol. 1997;15:749-95. doi: 10.1146/annurev.immunol.15.1.749. Annu Rev Immunol. 1997. PMID: 9143706 Review. - Post-transcriptional control of the interferon system.
Khabar KS, Young HA. Khabar KS, et al. Biochimie. 2007 Jun-Jul;89(6-7):761-9. doi: 10.1016/j.biochi.2007.02.008. Epub 2007 Feb 24. Biochimie. 2007. PMID: 17408842 Free PMC article. Review.
Cited by
- Cloning and Functional Characterization of Novel Human Neutralizing Anti-IFN-α and Anti-IFN-β Antibodies.
Papasavvas E, Lu L, Fair M, Oliva I, Cassel J, Majumdar S, Mounzer K, Kostman JR, Tebas P, Bar-Or A, Muthumani K, Montaner LJ. Papasavvas E, et al. J Immunol. 2024 Sep 15;213(6):808-822. doi: 10.4049/jimmunol.2400265. J Immunol. 2024. PMID: 39109927 - Machine learning reveals distinct gene signature profiles in lesional and nonlesional regions of inflammatory skin diseases.
Martínez BA, Shrotri S, Kingsmore KM, Bachali P, Grammer AC, Lipsky PE. Martínez BA, et al. Sci Adv. 2022 Apr 29;8(17):eabn4776. doi: 10.1126/sciadv.abn4776. Epub 2022 Apr 29. Sci Adv. 2022. PMID: 35486723 Free PMC article. - Integrative analysis of Multiple Sclerosis using a systems biology approach.
Cervantes-Gracia K, Husi H. Cervantes-Gracia K, et al. Sci Rep. 2018 Apr 4;8(1):5633. doi: 10.1038/s41598-018-24032-8. Sci Rep. 2018. PMID: 29618802 Free PMC article. - Induction of a unique isoform of the NCOA7 oxidation resistance gene by interferon β-1b.
Yu L, Croze E, Yamaguchi KD, Tran T, Reder AT, Litvak V, Volkert MR. Yu L, et al. J Interferon Cytokine Res. 2015 Mar;35(3):186-99. doi: 10.1089/jir.2014.0115. Epub 2014 Oct 20. J Interferon Cytokine Res. 2015. PMID: 25330068 Free PMC article. - A STING Agonist Given with OX40 Receptor and PD-L1 Modulators Primes Immunity and Reduces Tumor Growth in Tolerized Mice.
Foote JB, Kok M, Leatherman JM, Armstrong TD, Marcinkowski BC, Ojalvo LS, Kanne DB, Jaffee EM, Dubensky TW Jr, Emens LA. Foote JB, et al. Cancer Immunol Res. 2017 Jun;5(6):468-479. doi: 10.1158/2326-6066.CIR-16-0284. Epub 2017 May 8. Cancer Immunol Res. 2017. PMID: 28483787 Free PMC article.
References
- Isaacs A, Lindenmann J. Virus interference. I. The interferon. Proc R Soc Lond B Biol Sci. 1957;147:258–267. - PubMed
- Bach EA, Aguet M, Schreiber RD. The IFN gamma receptor: a paradigm for cytokine receptor signaling. Annu Rev Immunol. 1997;15:563–591. - PubMed
- Kotenko SV, Gallagher G, Baurin VV, Lewis-Antes A, Shen M, et al. IFN-lambdas mediate antiviral protection through a distinct class II cytokine receptor complex. Nat Immunol. 2003;4:69–77. - PubMed
- Sheppard P, Kindsvogel W, Xu W, Henderson K, Schlutsmeyer S, et al. IL-28, IL-29 and their class II cytokine receptor IL-28R. Nat Immunol. 2003;4:63–68. - PubMed
- Pestka S, Krause CD, Walter MR. Interferons, interferon-like cytokines, and their receptors. Immunol Rev. 2004;202:8–32. - PubMed
Publication types
MeSH terms
Substances
LinkOut - more resources
Full Text Sources
Other Literature Sources
Molecular Biology Databases
Research Materials


