Bidirectional changes to hippocampal theta-gamma comodulation predict memory for recent spatial episodes - PubMed (original) (raw)
Bidirectional changes to hippocampal theta-gamma comodulation predict memory for recent spatial episodes
Prasad R Shirvalkar et al. Proc Natl Acad Sci U S A. 2010.
Abstract
Episodic memory requires the hippocampus, which is thought to bind cortical inputs into conjunctive codes. Local field potentials (LFPs) reflect dendritic and synaptic oscillations whose temporal structure may coordinate cellular mechanisms of plasticity and memory. We now report that single-trial spatial memory performance in rats was predicted by the power comodulation of theta (4-10 Hz) and low gamma (30-50 Hz) rhythms in the hippocampus. Theta-gamma comodulation (TGC) was prominent during successful memory retrieval but was weak when memory failed or was unavailable during spatial exploration in sample trials. Muscimol infusion into medial septum reduced the probability of TGC and successful memory retrieval. In contrast, patterned electrical stimulation of the fimbria-fornix increased TGC in amnestic animals and partially rescued memory performance in the water maze. The results suggest that TGC accompanies memory retrieval in the hippocampus and that patterned brain stimulation may inform therapeutic strategies for cognitive disorders.
Conflict of interest statement
The authors declare no conflict of interest.
Figures
Fig. 1.
Procedures and effects of medial septal inactivation. (A) Overhead view of radial-arm water maze (diameter, 170 cm). Gray triangles show dividers between the numbered swim arms. The goal platform (box) was located in the same arm (here, arm 6) for all trials within a session. (B) Light photomicrographs of thionin-stained coronal brain sections illustrating placement of electrodes and cannula (white matter is pink, gray matter is blue). The locations of the MS cannula (Top Left), FFx stimulation electrode (Top Right), and hippocampal CA1-fissure recording electrode (Bottom) are indicated by arrowheads (see also
Fig. S1
). (C) Schematic of the rat brain indicating placement of recording and stimulating electrodes and cannula. HPC, hippocampus. (D) One-trial spatial learning was disrupted by MSI as shown by mean escape latencies (+ SE) in control (Left) and MSI (Right) trials. Red bars indicate sample trials. (E) MSI vs. control (saline infusion; Ctrl) performance measured by mean escape distance, latency, and errors per trial (for nongoal arm entries, see
Fig. S3
and
Table S1
). n = 6 rats. Error bars in D and E indicate SE; *, P < 0.001.
Fig. 2.
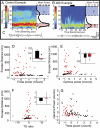
Neither theta nor gamma power alone predicted memory performance. (A) Typical theta and gamma rhythms recorded during a control trial. (Left) Time–frequency spectrogram shows spectral density over time. Red and blue represent high and low power, respectively, normalized within specific frequencies. (Right) Trial-averaged power in the spectrogram shows prominent theta (θ) and gamma (γ) rhythms in a control trial (A) and their attenuation in a typical MSI trial (B). Note that the trials shown in A and B differ in duration. (C) Examples of theta bandpass-filtered (4–10 Hz) LFP waveforms from control (Left) and MSI (Right) trials. (
Fig. S7
shows unfiltered traces.) The duration of the MSI LFP sample matches the duration of the black bar above the spectrogram in B. (D_–_G) Scatter plots for each control (black) and MSI (red) trial for all animals. Insets in D, G, and F show the mean of the values on the x axis in the main plots (across-treatments ANOVA; P < 0.01). (D) Mean theta power did not predict trial-wise escape distance. Inset shows theta power was significantly lower in MSI trials (mean −0.05, shown in red) than in control trials (mean 0.58, shown in black) (P < 0.01). (E) Mean gamma power versus escape distance revealed no significant difference between treatments. (F) The theta/gamma ratio was not linearly related to escape distance. (G) Trial-averaged theta and gamma power were not correlated. Error bars in _D_-F indicate SE.
Fig. 3.
TGC predicted successful memory performance. (A_–_C) Examples of cross-spectral comodulation plots (symmetric about x = y) after MSI in three different trials in the same rat show increasing TGC with performance improving from A to B to C. Red and blue represent high and low power comodulation, respectively. Dashed boxes indicate power correlations (Pearson's r) between theta (4–10 Hz) and gamma (30–50 Hz) ranges. Each correlation value within the dashed box was Fisher's z transformed and averaged with the other values to obtain a mean TGC value for each trial. (D_–_F) Examples of comodulation plots for three control trials all show relatively high TGC. (G) Scatter plot of TGC vs. escape distance for control (black) and MSI (blue = success, red = error) trials. Each dot shows the mean TGC value and escape distance for one trial; all trials for each treatment are shown. Arrowheads indicate the trials using the rat plotted in A – C. Linear regressions of Fisher's _z_-transformed TGC values yielded significant fits for both control and MSI conditions (text and
Fig. S6 A and B
). (H) Subtraction between the mean success and mean error trial comodulation plots in the MSI condition (see
Fig. S2
). Large red bands along the x and y axes indicate a robust increase in TGC for success trials. Arrows indicate the lower limit of theta frequency (4 Hz). (I) Profile of subtraction comodulation (from H) between theta and all other frequencies. The vertical gray line indicates the lower limit of gamma rhythm (30 Hz). (J) Mean TGC values in success and error trials. The central red bar indicates the median, and the edges of boxes indicate 25th and 75th percentiles, respectively. Error bars show full range of data (*, t1,43 = −2.68; P = 0.01). (K) Examples of theta (red) and gamma (blue) power dynamics in success (Top) and error (Bottom) trials. In this panel only, theta and gamma power were normalized to maximum power to show relative power fluctuations.
Fig. 4.
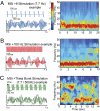
FFx stimulation protocols and TGC. (A_–_C Left) Sample theta and gamma bandpass-filtered waveforms during MSI + stimulation. (In the lower plots, amplitude heights were made equal for display). Stimulus patterns for (A) MSI + theta (7.7 Hz), (B) MSI + 100 Hz, and (C) TBS. In A, the horizontal line above the train shows the stimulus pulse width (100 us), and the horizontal line below the train shows interpulse interval (130 ms). In B, the horizontal line below the train shows the time scale. In C, the horizontal line above the train shows the interpulse interval (2 ms), and the horizontal line below the train shows the interburst interval (130 ms). Stimulation was given throughout the trial. (A–C Right) Sample time–frequency spectrograms for MSI + stimulation for each protocol. The different time scales reflect different trial durations. Red and blue indicate high and low relative power, respectively. Note the relative absence of gamma power in A compared with B and C (
Fig. S5_B_
).
Fig. 5.
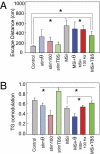
Patterned FFx stimulation modulated TGC and memory performance. (A) Treatment conditions vs. escape distance for all trials. Each treatment is depicted in a unique color. Brackets and asterisks indicate significant treatment differences in task performance (F7,333 = 15.38, P < 0.001) (
Table S1
). (B) Treatment conditions vs. TGC (ANOVA: F7,334 = 17.52, P < 0.001) (
Table S2
). Control + TBS (StimTBS) condition is significantly greater than all conditions except control. Note that the figure shows TGC values as Pearson's r; the ANOVA analyzed Fisher's z transforms of these (Methods). Not all significant differences are indicated in the figure; further details are given in
Tables S1
and
S2
.
Similar articles
- Artificial theta stimulation impairs encoding of contextual fear memory.
Lipponen A, Woldemichael BT, Gurevicius K, Tanila H. Lipponen A, et al. PLoS One. 2012;7(11):e48506. doi: 10.1371/journal.pone.0048506. Epub 2012 Nov 1. PLoS One. 2012. PMID: 23133638 Free PMC article. - Stimulation of the medial septum improves performance in spatial learning following pilocarpine-induced status epilepticus.
Lee DJ, Izadi A, Melnik M, Seidl S, Echeverri A, Shahlaie K, Gurkoff GG. Lee DJ, et al. Epilepsy Res. 2017 Feb;130:53-63. doi: 10.1016/j.eplepsyres.2017.01.005. Epub 2017 Jan 17. Epilepsy Res. 2017. PMID: 28152425 - A double dissociation of subcortical hippocampal efferents for encoding and consolidation/retrieval of spatial information.
Hunsaker MR, Tran GT, Kesner RP. Hunsaker MR, et al. Hippocampus. 2008;18(7):699-709. doi: 10.1002/hipo.20429. Hippocampus. 2008. PMID: 18493950 - Functional role of gamma and theta oscillations in episodic memory.
Nyhus E, Curran T. Nyhus E, et al. Neurosci Biobehav Rev. 2010 Jun;34(7):1023-35. doi: 10.1016/j.neubiorev.2009.12.014. Epub 2010 Jan 6. Neurosci Biobehav Rev. 2010. PMID: 20060015 Free PMC article. Review. - Linking temporal coordination of hippocampal activity to memory function.
Etter G, Carmichael JE, Williams S. Etter G, et al. Front Cell Neurosci. 2023 Aug 31;17:1233849. doi: 10.3389/fncel.2023.1233849. eCollection 2023. Front Cell Neurosci. 2023. PMID: 37720546 Free PMC article. Review.
Cited by
- Theta oscillons in behaving rats.
Zobaer MS, Lotfi N, Domenico CM, Hoffman C, Perotti L, Ji D, Dabaghian Y. Zobaer MS, et al. bioRxiv [Preprint]. 2024 Apr 25:2024.04.21.590487. doi: 10.1101/2024.04.21.590487. bioRxiv. 2024. PMID: 38712230 Free PMC article. Preprint. - Theta oscillons in behaving rats.
Zobaer MS, Lotfi N, Domenico CM, Hoffman C, Perotti L, Ji D, Dabaghian Y. Zobaer MS, et al. ArXiv [Preprint]. 2024 Apr 22:arXiv:2404.13851v1. ArXiv. 2024. PMID: 38711435 Free PMC article. Preprint. - Neural circuits for the adaptive regulation of fear and extinction memory.
Plas SL, Tuna T, Bayer H, Juliano VAL, Sweck SO, Arellano Perez AD, Hassell JE, Maren S. Plas SL, et al. Front Behav Neurosci. 2024 Feb 2;18:1352797. doi: 10.3389/fnbeh.2024.1352797. eCollection 2024. Front Behav Neurosci. 2024. PMID: 38370858 Free PMC article. Review. - Gamma music: a new acoustic stimulus for gamma-frequency auditory steady-state response.
Yokota Y, Tanaka K, Chang M, Naruse Y, Imamura Y, Fujii S. Yokota Y, et al. Front Hum Neurosci. 2024 Jan 11;17:1287018. doi: 10.3389/fnhum.2023.1287018. eCollection 2023. Front Hum Neurosci. 2024. PMID: 38273878 Free PMC article. - The medial septum controls hippocampal supra-theta oscillations.
Király B, Domonkos A, Jelitai M, Lopes-Dos-Santos V, Martínez-Bellver S, Kocsis B, Schlingloff D, Joshi A, Salib M, Fiáth R, Barthó P, Ulbert I, Freund TF, Viney TJ, Dupret D, Varga V, Hangya B. Király B, et al. Nat Commun. 2023 Oct 10;14(1):6159. doi: 10.1038/s41467-023-41746-0. Nat Commun. 2023. PMID: 37816713 Free PMC article.
References
- Eichenbaum H. Hippocampus: Cognitive processes and neural representations that underlie declarative memory. Neuron. 2004;44:109–120. - PubMed
- Sterman MB, Kaiser DA. Comodulation: A new QEEG analysis metric for assessment of structural and functional disorders of the CNS. J Neurother. 2001;4:73–84.
- Masimore B, Kakalios J, Redish AD. Measuring fundamental frequencies in local field potentials. J Neurosci Methods. 2004;138:97–105. - PubMed
- Singer W. Neuronal synchrony: A versatile code for the definition of relations? Neuron. 1999;24:49–65. 111–125. - PubMed
- von der Malsburg C, Schneider W. A neural cocktail-party processor. Biol Cybern. 1986;54:29–40. - PubMed
Publication types
MeSH terms
Substances
Grants and funding
- F30 AG034003-01A1/AG/NIA NIH HHS/United States
- R01 MH065658/MH/NIMH NIH HHS/United States
- ImNIH/Intramural NIH HHS/United States
- F30 AG034003/AG/NIA NIH HHS/United States
- R01 MH073689/MH/NIMH NIH HHS/United States
- MH073689/MH/NIMH NIH HHS/United States
- MH65658/MH/NIMH NIH HHS/United States
LinkOut - more resources
Full Text Sources
Other Literature Sources
Medical


