Short-term antibiotic treatment has differing long-term impacts on the human throat and gut microbiome - PubMed (original) (raw)
Short-term antibiotic treatment has differing long-term impacts on the human throat and gut microbiome
Hedvig E Jakobsson et al. PLoS One. 2010.
Abstract
Antibiotic administration is the standard treatment for the bacterium Helicobacter pylori, the main causative agent of peptic ulcer disease and gastric cancer. However, the long-term consequences of this treatment on the human indigenous microbiota are relatively unexplored. Here we studied short- and long-term effects of clarithromycin and metronidazole treatment, a commonly used therapy regimen against H. pylori, on the indigenous microbiota in the throat and in the lower intestine. The bacterial compositions in samples collected over a four-year period were monitored by analyzing the 16S rRNA gene using 454-based pyrosequencing and terminal-restriction fragment length polymorphism (T-RFLP). While the microbial communities of untreated control subjects were relatively stable over time, dramatic shifts were observed one week after antibiotic treatment with reduced bacterial diversity in all treated subjects in both locations. While the microbiota of the different subjects responded uniquely to the antibiotic treatment some general trends could be observed; such as a dramatic decline in Actinobacteria in both throat and feces immediately after treatment. Although the diversity of the microbiota subsequently recovered to resemble the pre treatment states, the microbiota remained perturbed in some cases for up to four years post treatment. In addition, four years after treatment high levels of the macrolide resistance gene erm(B) were found, indicating that antibiotic resistance, once selected for, can persist for longer periods of time than previously recognized. This highlights the importance of a restrictive antibiotic usage in order to prevent subsequent treatment failure and potential spread of antibiotic resistance.
Conflict of interest statement
Competing Interests: The authors have declared that no competing interests exist.
Figures
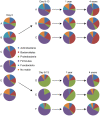
Figure 1. Phyla distribution in throat samples.
Pie charts showing the phyla found in throat samples at day 0, day 8–13, 1 and 4 years in three controls (A, B, and C) and three antibiotic treated patients (D, E, and F). By using 16S rRNA pyrosequencing five different phyla were found in the throat samples; Firmicutes, Proteobacteria, Actinobacteria, Bacteroidetes, and Fusobacteria.
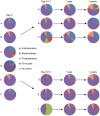
Figure 2. Phyla distribution in fecal samples.
Pie charts showing the phyla found in fecal samples at day 0, day 8–13, 1 and 4 years in three controls (A, B, and C) and three antibiotic treated patients (D, E, and F). By using 16S rRNA pyrosequencing four different phyla were found in fecal samples; Firmicutes, Proteobacteria, Actinobacteria, and Bacteroidetes.
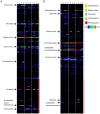
Figure 3. Individualized antibiotic responses.
The heat maps show the relative abundance per sample of different taxonomic groups found in throat (A) or fecal (B) patient samples. The color panel shows the percent relative abundance (0–70%) of different taxonomic groups within the major phyla (Actinobacteria, Bacteroidetes, Firmicutes, Fusobacterium and Proteobacteria) detected from patients at day 0 (1), day 8–13 (2), 1 year (3) and 4 years (4) after treatment.
Figure 4. Correlation plots for the controls.
Correlation plots showing OTU frequency at day 0 (x-axis), and day 8–13, 1 and 4 years (y-axis) in throat (A) and fecal (B) samples in the controls (A, B, and C). Bray-Curtis values are indicated as numbers in the figure as a number. A Bray Curtis value of 0 suggest the two sites have the same composition and 1 means the two sites do not share any species. The color of the dots represent different phyla: yellow, Actinobacteria; green, Bacteroidetes; blue, Firmicutes; red, Proteobacteria; grey, other phyla. Percentages of inter-sample variation explained by the two axes are shown in the figures.
Figure 5. Correspondence analysis of the bacterial community found in throat samples.
Each correspondence analysis plot represents the relative abundance values for the OTUs from the 16S rRNA pyrosequencing at day 0, day 8–13, 1 and 4 years. A: Controls; A, B, and C. B: Antibiotic treated patients; D, E, and F. Percentages of inter-sample variation explained, by the two axes are shown in the figures. In controls A–C and patients D–F the third axis represented 25%, 27%, 26%, 22%, 24%, and 20% of the variation.
Figure 6. Correspondence analysis of the bacterial community found in fecal samples.
Each correspondence analysis plot represents the relative abundance values for the OTUs from the 16S rRNA pyrosequencing at day 0, day 8–13, 1 and 4 years. A: Controls; A, B, and C. B: Antibiotic treated patients; D, E, and F. Percentages of inter-sample variation explained, by the two axes are shown in the figures. In controls A–C and patients D–F the third axis represented 19%, 17%, 20%, 26%, 20%, and 20% of the variation.
Figure 7. Correlation plots for the patients.
Correlation plots showing OTU frequency at day 0 (x-axis), day 8–13, 1 and 4 years (y-axis) in throat (A) and fecal (B) samples in the patients (D, E, and F). Bray-Curtis values are indicated as numbers in the figure. A Bray Curtis value of 0 suggest the two sites have the same composition and 1 that the two sites do not share any species. The colors of the dots represent different phyla: yellow, Actinobacteria; green, Bacteroidetes; blue, Firmicutes; red, Proteobacteria; grey, other phyla.
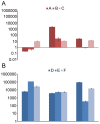
Figure 8. erm(B) abundance over time.
The normalized fold increase of erm(B) compared to day 0 in community DNA extracted from fecal samples for controls (A–C) not receiving any treatment (A) and patients (D–F) receiving antibiotics (B). Each bar graph represents the mean and standard error of the normalized expression of erm(B) compared to 16S. Normalization was carried out as previously been described .
Similar articles
- Long-term changes of gut microbiota, antibiotic resistance, and metabolic parameters after Helicobacter pylori eradication: a multicentre, open-label, randomised trial.
Liou JM, Chen CC, Chang CM, Fang YJ, Bair MJ, Chen PY, Chang CY, Hsu YC, Chen MJ, Chen CC, Lee JY, Yang TH, Luo JC, Chen CY, Hsu WF, Chen YN, Wu JY, Lin JT, Lu TP, Chuang EY, El-Omar EM, Wu MS; Taiwan Gastrointestinal Disease and Helicobacter Consortium. Liou JM, et al. Lancet Infect Dis. 2019 Oct;19(10):1109-1120. doi: 10.1016/S1473-3099(19)30272-5. Lancet Infect Dis. 2019. PMID: 31559966 Clinical Trial. - Macrolide resistance in the normal microbiota after Helicobacter pylori treatment.
Jakobsson H, Wreiber K, Fall K, Fjelstad B, Nyrén O, Engstrand L. Jakobsson H, et al. Scand J Infect Dis. 2007;39(9):757-63. doi: 10.1080/00365540701299608. Scand J Infect Dis. 2007. PMID: 17701712 - Effects of anti-Helicobacter pylori concomitant therapy and probiotic supplementation on the throat and gut microbiota in humans.
Wang ZJ, Chen XF, Zhang ZX, Li YC, Deng J, Tu J, Song ZQ, Zou QH. Wang ZJ, et al. Microb Pathog. 2017 Aug;109:156-161. doi: 10.1016/j.micpath.2017.05.035. Epub 2017 May 25. Microb Pathog. 2017. PMID: 28552806 Clinical Trial. - [Antibiotic resistance of Helicobacter pylori in Malmö. Therapeutic success in spite of antibiotic resistance].
Nilsson F, Walder M. Nilsson F, et al. Lakartidningen. 1999 Feb 3;96(5):460-3. Lakartidningen. 1999. PMID: 10064930 Review. Swedish. - Helicobacter pylori and gastric or duodenal ulcer.
[No authors listed] [No authors listed] Prescrire Int. 2016 Jan;25(167):18-23. Prescrire Int. 2016. PMID: 26942258 Review.
Cited by
- Pathogenicity potential of enterococci isolated from a Veterinary Biological Isolation and Containment Unit.
Geraldes C, Araújo C, Pinheiro AC, Afonso M, Carapeto S, Verdial C, Cunha E, Abreu R, Tavares L, Chambel L, Gil S, Oliveira M. Geraldes C, et al. Front Vet Sci. 2024 Oct 21;11:1458069. doi: 10.3389/fvets.2024.1458069. eCollection 2024. Front Vet Sci. 2024. PMID: 39497740 Free PMC article. - Effect of antibiotic drug use on outcome and therapy-related toxicity in patients with glioblastoma-A retrospective cohort study.
Götz L, Ansafi T, Gerken M, Klinkhammer-Schalke M, Fischl A, Riemenschneider MJ, Proescholdt M, Bumes E, Kölbl O, Schmidt NO, Linker R, Hau P, Haedenkamp TM. Götz L, et al. Neurooncol Adv. 2024 Oct 4;6(1):vdae170. doi: 10.1093/noajnl/vdae170. eCollection 2024 Jan-Dec. Neurooncol Adv. 2024. PMID: 39493414 Free PMC article. - Effects of Helicobacter pylori and Helicobacter pylori eradication on the microbiota of tongue coating.
Li C, Qian X, Zhang Z, Jiang Z. Li C, et al. BMC Microbiol. 2024 Oct 18;24(1):416. doi: 10.1186/s12866-024-03584-y. BMC Microbiol. 2024. PMID: 39425053 Free PMC article. - A review of the pathogenesis of epilepsy based on the microbiota-gut-brain-axis theory.
Yang W, Cui H, Wang C, Wang X, Yan C, Cheng W. Yang W, et al. Front Mol Neurosci. 2024 Oct 3;17:1454780. doi: 10.3389/fnmol.2024.1454780. eCollection 2024. Front Mol Neurosci. 2024. PMID: 39421261 Free PMC article. Review. - Invasions of Host-Associated Microbiome Networks.
Murall CL, Abbate JL, Touzel MP, Allen-Vercoe E, Alizon S, Froissart R, McCann K. Murall CL, et al. Adv Ecol Res. 2017;57:201-281. doi: 10.1016/bs.aecr.2016.11.002. Adv Ecol Res. 2017. PMID: 39404686 Free PMC article.
References
- Gibson GR, Roberfroid MB. Dietary modulation of the human colonic microbiota: introducing the concept of prebiotics. J Nutr. 1995;125:1401–1412. - PubMed
- Guarner F. Enteric flora in health and disease. Digestion. 2006;73(Suppl 1):5–12. - PubMed
Publication types
MeSH terms
Substances
LinkOut - more resources
Full Text Sources
Other Literature Sources
Medical


