Motif Enrichment Analysis: a unified framework and an evaluation on ChIP data - PubMed (original) (raw)
Motif Enrichment Analysis: a unified framework and an evaluation on ChIP data
Robert C McLeay et al. BMC Bioinformatics. 2010.
Abstract
Background: A major goal of molecular biology is determining the mechanisms that control the transcription of genes. Motif Enrichment Analysis (MEA) seeks to determine which DNA-binding transcription factors control the transcription of a set of genes by detecting enrichment of known binding motifs in the genes' regulatory regions. Typically, the biologist specifies a set of genes believed to be co-regulated and a library of known DNA-binding models for transcription factors, and MEA determines which (if any) of the factors may be direct regulators of the genes. Since the number of factors with known DNA-binding models is rapidly increasing as a result of high-throughput technologies, MEA is becoming increasingly useful. In this paper, we explore ways to make MEA applicable in more settings, and evaluate the efficacy of a number of MEA approaches.
Results: We first define a mathematical framework for Motif Enrichment Analysis that relaxes the requirement that the biologist input a selected set of genes. Instead, the input consists of all regulatory regions, each labeled with the level of a biological signal. We then define and implement a number of motif enrichment analysis methods. Some of these methods require a user-specified signal threshold, some identify an optimum threshold in a data-driven way and two of our methods are threshold-free. We evaluate these methods, along with two existing methods (Clover and PASTAA), using yeast ChIP-chip data. Our novel threshold-free method based on linear regression performs best in our evaluation, followed by the data-driven PASTAA algorithm. The Clover algorithm performs as well as PASTAA if the user-specified threshold is chosen optimally. Data-driven methods based on three statistical tests-Fisher Exact Test, rank-sum test, and multi-hypergeometric test--perform poorly, even when the threshold is chosen optimally. These methods (and Clover) perform even worse when unrestricted data-driven threshold determination is used.
Conclusions: Our novel, threshold-free linear regression method works well on ChIP-chip data. Methods using data-driven threshold determination can perform poorly unless the range of thresholds is limited a priori. The limits implemented in PASTAA, however, appear to be well-chosen. Our novel algorithms--AME (Analysis of Motif Enrichment)-are available at http://bioinformatics.org.au/ame/.
Figures
Figure 1
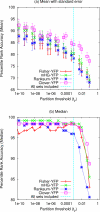
Accuracy of MEA methods using fixed Y partitions. The ability of different MEA methods to correctly rank the known TF motif in 237 yeast ChIP-chip experiments is shown. Each point corresponds to the mean (Panel a) or the median (Panel b) percentile rank accuracy (PRA) of an MEA method on all ChIP-chip datasets that contain at least one sequence with a fluorescence _p_-value less than the value of t y (_X_-axis). Increasing X values correspond to relaxing the threshold for a sequence to be considered bound by a TF. To the right of the vertical line, all 237 sets are included; to the left, increasingly fewer sets are included at stricter t y thresholds.
Figure 2
Accuracy of MEA methods using unconstrained-_Y_-partition-maximisation. The ability of different MEA methods to correctly rank the known TF motif in 237 yeast ChIP-chip experiments is shown. The mean percentile rank accuracy of unconstrained-_Y_-partition-maximization (YUPM, blue bars) and fixed-partition (YFP, red bars, t y = 0.001) variants of four MEA methods is shown. Error bars show standard error.
Figure 3
Accuracy of the mHG method constrained to at most 300 positive sequences. The ability of three variants of the mHG method to correctly rank the known TF motif in 237 yeast ChIP-chip experiments is shown. Each bar represents the mean PRA of versions of an MEA method. The bar labeled mHG-YDRIM shows accuracy using partition maximization, limited to partitions with a maximum of 300 "positive" sequences. The other two bars show accuracy using the fixed partition method with t y = 0.001 (mHG-YFP) and and unconstrained partition maximisation (mHG-YUPM), respectively.
Figure 4
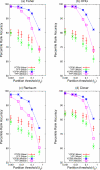
Accuracy of MEA methods using constrained partition-maximization. The ability of different MEA methods to correctly rank the known TF motif in 237 yeast ChIP-chip experiments is shown. Each panel shows the accuracy of the Y constrained partition maximization (YCPM) of a method, along with the fixed partition (YFP) variant's accuracy for comparison. Each point shows the mean or median PRA (_Y_-axis) of the MEA method. For YCPM methods, the _X_-axis of the plot is the maximum value, b, that t y may assume; for YFP methods, it is the method's fixed threshold, t y.
Figure 5
Accuracy of a partition-free MEA method. The ability of different MEA method to correctly rank the known TF motif in 237 yeast ChIP-chip experiments is shown. Each bar shows the mean PRA of the given MEA method on all 237 ChIP-chip datasets. Error bars show standard error. The LR method is partition free. PASTAA uses X and Y constrained partition maximization with a maximum of 1000 sequences in the "positive" sets. All fixed-partition (YFP) methods use a threshold of t y = 0.001.
Similar articles
- Differential motif enrichment analysis of paired ChIP-seq experiments.
Lesluyes T, Johnson J, Machanick P, Bailey TL. Lesluyes T, et al. BMC Genomics. 2014 Sep 2;15(1):752. doi: 10.1186/1471-2164-15-752. BMC Genomics. 2014. PMID: 25179504 Free PMC article. - MEME-ChIP: motif analysis of large DNA datasets.
Machanick P, Bailey TL. Machanick P, et al. Bioinformatics. 2011 Jun 15;27(12):1696-7. doi: 10.1093/bioinformatics/btr189. Epub 2011 Apr 12. Bioinformatics. 2011. PMID: 21486936 Free PMC article. - Inferring direct DNA binding from ChIP-seq.
Bailey TL, Machanick P. Bailey TL, et al. Nucleic Acids Res. 2012 Sep 1;40(17):e128. doi: 10.1093/nar/gks433. Epub 2012 May 18. Nucleic Acids Res. 2012. PMID: 22610855 Free PMC article. - An algorithmic perspective of de novo cis-regulatory motif finding based on ChIP-seq data.
Liu B, Yang J, Li Y, McDermaid A, Ma Q. Liu B, et al. Brief Bioinform. 2018 Sep 28;19(5):1069-1081. doi: 10.1093/bib/bbx026. Brief Bioinform. 2018. PMID: 28334268 Review. - A brief survey of tools for genomic regions enrichment analysis.
Chicco D, Jurman G. Chicco D, et al. Front Bioinform. 2022 Oct 26;2:968327. doi: 10.3389/fbinf.2022.968327. eCollection 2022. Front Bioinform. 2022. PMID: 36388843 Free PMC article. Review.
Cited by
- Genomic background sequences systematically outperform synthetic ones in de novo motif discovery for ChIP-seq data.
Raditsa VV, Tsukanov AV, Bogomolov AG, Levitsky VG. Raditsa VV, et al. NAR Genom Bioinform. 2024 Jul 27;6(3):lqae090. doi: 10.1093/nargab/lqae090. eCollection 2024 Sep. NAR Genom Bioinform. 2024. PMID: 39071850 Free PMC article. - The Arabidopsis CERK1-associated kinase PBL27 connects chitin perception to MAPK activation.
Yamada K, Yamaguchi K, Shirakawa T, Nakagami H, Mine A, Ishikawa K, Fujiwara M, Narusaka M, Narusaka Y, Ichimura K, Kobayashi Y, Matsui H, Nomura Y, Nomoto M, Tada Y, Fukao Y, Fukamizo T, Tsuda K, Shirasu K, Shibuya N, Kawasaki T. Yamada K, et al. EMBO J. 2016 Nov 15;35(22):2468-2483. doi: 10.15252/embj.201694248. Epub 2016 Sep 27. EMBO J. 2016. PMID: 27679653 Free PMC article. - A critical period of translational control during brain development at codon resolution.
Harnett D, Ambrozkiewicz MC, Zinnall U, Rusanova A, Borisova E, Drescher AN, Couce-Iglesias M, Villamil G, Dannenberg R, Imami K, Münster-Wandowski A, Fauler B, Mielke T, Selbach M, Landthaler M, Spahn CMT, Tarabykin V, Ohler U, Kraushar ML. Harnett D, et al. Nat Struct Mol Biol. 2022 Dec;29(12):1277-1290. doi: 10.1038/s41594-022-00882-9. Epub 2022 Dec 8. Nat Struct Mol Biol. 2022. PMID: 36482253 Free PMC article. - Multiplex indexing approach for the detection of DNase I hypersensitive sites in single cells.
Gao W, Ku WL, Pan L, Perrie J, Zhao T, Hu G, Wu Y, Zhu J, Ni B, Zhao K. Gao W, et al. Nucleic Acids Res. 2021 Jun 4;49(10):e56. doi: 10.1093/nar/gkab102. Nucleic Acids Res. 2021. PMID: 33693880 Free PMC article. - Specificity of Pitx3-Dependent Gene Regulatory Networks in Subsets of Midbrain Dopamine Neurons.
Bifsha P, Balsalobre A, Drouin J. Bifsha P, et al. Mol Neurobiol. 2017 Sep;54(7):4921-4935. doi: 10.1007/s12035-016-0040-y. Epub 2016 Aug 11. Mol Neurobiol. 2017. PMID: 27514757
References
Publication types
MeSH terms
Substances
LinkOut - more resources
Full Text Sources
Other Literature Sources
Molecular Biology Databases


