Prospective isolation of cortical interneuron precursors from mouse embryonic stem cells - PubMed (original) (raw)
Prospective isolation of cortical interneuron precursors from mouse embryonic stem cells
Asif Mirza Maroof et al. J Neurosci. 2010.
Abstract
Despite their therapeutic potential, progress in generating fully differentiated forebrain neurons from embryonic stem cells (ESCs) has lagged behind that from more caudal regions of the neuraxis. GABAergic interneuron precursors have the remarkable ability to migrate extensively and survive after transplantation into postnatal cortex, making them an attractive candidate for use in cell-based therapy for seizures or other neuropsychiatric disorders. We have modified a mouse ESC line with an Lhx6-GFP reporter construct that allows for the isolation of newly generated cortical interneuron precursors. When transplanted into postnatal cortex, these cells can migrate into the cortical parenchyma, survive for months, and display morphological, neurochemical, and electrophysiological properties characteristic of mature interneurons. This work demonstrates that forebrain neuronal subtypes with complex traits can be generated from embryonic stem cells, and provides a novel approach to the study of cortical interneuron development and to the establishment of cell-based therapies for neurological disease.
Figures
Figure 1.
Generation of mouse ES cell-derived, MGE-like interneuronal precursors. A, The paradigm for differentiating ES cells toward ventral forebrain progenitors. B, Model of the transcriptional profile of interneuronal precursors migrating in the developing telencephalon, as viewed through a coronal section at E13.5. FoxG1 is expressed throughout the telencephalon, while Nkx2.1 is expressed in the MGE and the preoptic area. Lhx6 is continuously expressed from the postmitotic state through adulthood. C–E, ES cells differentiated with the ventral telencephalon protocol for 12 d. The sample in C shows the telencephalic marker FoxG1. Many of the FoxG1-expressing cells also express the MGE marker Nkx2.1 (yellow; C1). D, Lhx6+ cells appear to be streaming from an Nkx2.1+ cluster. E, F, Differentiated cells from the Lhx6::GFP reporter mES line. The GFP+ cells appear to be streaming out of Nkx2.1+ progenitor domains (E), and these cells colabel for Lhx6 protein (F, F1). G, FACS analysis of the Lhx6::GFP line differentiated until day 12 shows a GFP+ population clearly segregating from the autofluorescent background. Yield based on FACS (GFP+ cells whose viability is established by DAPI exclusion) is ∼2%. H, GFP+ cells were plated on glass coverslips and then immunolabeled for the indicated markers. The Lhx6::GFP+ cells generally express the telencephalic marker FoxG1, the neurotransmitter GABA, Lhx6, and the ventral telencephalic marker Dlx2. There was <1% colabeling for the dorsal telencephalic markers Pax6 or Tbr1. Scale bars: C–E, 20 μm; F, 10 μm.
Figure 2.
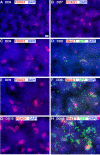
Development of FoxG1, Nkx2.1, and GFP in mouse ES Lhx6-GFP-derived cultures. Cells were differentiated by the protocol described in Figure 1_A_, in which floating embryoid bodies are dissociated and plated on adherent substrate at dd5. Blue signal shows the nuclear staining for DAPI in all panels. A–C, E, G, The telencephalic marker FoxG1 begins to be expressed in scattered cells by 1 d after plating (dd6), and clusters of these cells increase in size and number through dd10. D, F, H, Nkx2.1 (red signal), expressed in a substantial subset of FoxG1+ cells in these cultures (Fig. 1_C1_), is expressed in a few scattered cells at day 7 (D) and increases similarly to FoxG1 expression through day 10 (H). Lhx6-GFP expression (green signal) is apparent in differentiating-appearing, process-bearing cells that often occur adjacent to Nkx2.1+ clusters. Lhx6-GFP expression is rare at dd8 (D), and increases substantially by dd10 (H). Scale bar, 100 μm.
Figure 3.
Nearly all Lhx6::GFP+ cells are postmitotic 1 d after transplantation. A, Immunofluorescence labeling for GFP in a 50 μm coronal section showing the location of an injection site 1 d following transplantation into neonatal cortex. B–E, Same view of the cell indicated by the arrow in A showing Ki67 (B), GFP (C), and DAPI (D; merged image in E). Colabeling of GFP and the cell cycle marker ki67 is very rare (<1%), indicating that Lhx6::GFP+ cells have generally exited the cell cycle either before or shortly after the time of transplantation. No evidence of tumor formation was found in any of the over two dozen transplantations that have been evaluated at 1–240 d following transplantation.
Figure 4.
Migration and survival of Lhx6::GFP+ cells transplanted into neonatal cortex. A–F, Immunofluorescence labeling of GFP in 50 μm coronal sections. Arrows indicate cells shown at higher magnification in the insets (A and D show the same section shown in Fig. 3). At 1 DPT, the GFP+ cells were distributed close to the injection site, and many appear to be migrating into the cortical parenchyma. B, E, At 7 DPT, the GFP+ cells are much more broadly distributed, and many have multipolar morphologies suggestive of postmigratory neurons. C, F, The mediolateral extent of these cells at 30 DPT is 2.5 ± 0.3 mm. G–I, Distributions of transplanted cells 1 (G, n = 3), 7 (H, n = 4), or 30 (I, n = 5) days after transplantation. The _x_-axes show rostral–caudal distance from the injection site. The _y_-axes show cell profile number per 250 μm bin made conservatively by multiplying the number of GFP+ cell profiles in the most distal section of that bin by 5. In I, the _y_-axis extends to 100 cells. G, After 1 DPT, the bulk of transplanted cells are within 300 μm of the injection site. H, By 7 DPT, some of the cells have dispersed as far as 2 mm from the injection site. I, Although the survival or detectability of GFP+ cells had significantly decreased by 30 DPT, the rostral–caudal distribution is approximately equivalent to that seen at 7 DPT. Scale bars: A, 200 μm; B, C, 400 μm.
Figure 5.
Transplantation of mES-derived, Lhx6::GFP+ cells into postnatal cortex gives rise to interneuron-like cells. Lhx6::GFP+ cells were differentiated, collected by FACS, then transplanted into the cortical plate of neonatal pups. Shown is immunolabeling of 50 μm coronal sections taken at 65 DPT. A, The GFP+ cells mainly exhibit multipolar, aspiny morphologies commonly present in cortical interneurons. Scale bar, 100 μm. B, B1, The majority of these cells (>85%, see Results) express GABA. C–C3, Confocal images of a section labeled for GFP (C), NPY (C1), and somatostatin (SST; C2; merged image in C3). As occurs ex vivo, there is partial overlap between the NPY+ and SST+ interneuron subgroups (arrowheads show SST-expressing ES-derived cells, small arrows indicate cells that coexpress NPY). D, D1, Colabeling of two GFP+ cells with PV (arrows in D show colabeled cells in D1). As expected, the Lhx6::GFP and PV+ colabeled cells do not express SST (blue pseudocolor from Cy5 signal), but express the potassium channel KV3.1 (E–E2).
Figure 6.
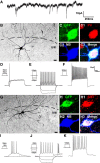
mES-derived, Lhx6-GFP+ cells exhibit physiological and neurochemical characteristics of cortical interneurons. Lhx6-GFP cells were differentiated and transplanted as in Figure 5. Twenty-two days after transplantation, slices from these animals were subjected to whole-cell patch-clamp recordings and fluorescence labeling. A, Spontaneous synaptic inputs recorded from a GFP+ cell voltage-clamped at −60 mV. B–K, Neurochemical profiles and physiological responses of two transplanted cells. Images are formed from collapsed stacks taken by confocal microscopy. B, G, Monochrome images of the Neurobiotin–streptavidin–Alexa 546 signals. Higher-magnification views are shown in C–C3 and H–H3, where the Neurobiotin (NB) signal (C2, H2) has been pseudocolored blue to demonstrate that the same cell soma is being imaged as that shown at lower magnification. These cells were subjected to electrophysiological recordings, with current injection protocols testing threshold current injection (D, I), response to hyperpolarizing current injection and 2× threshold (E, J), and suprathreshold (5×) current injection that elicited discharge of action potentials at a near-maximal firing frequency (F, K). The cell in B colabels for GFP (C), PV (C1; red pseudocolored from Cy5 signal), and NB (C2) and exhibited a fast-spiking discharge pattern (E, F) typical of PV-expressing interneurons. The cell in G colabels for GFP (H), somatostatin (SST, H1; red pseudocolored from Cy5 signal), and NB (H2) and exhibited a rebound, adapting, non-fast-spiking pattern (I–K) typical of many SST-expressing interneurons. Scale bars: B, G, 20 μm.
Similar articles
- Duration of culture and sonic hedgehog signaling differentially specify PV versus SST cortical interneuron fates from embryonic stem cells.
Tyson JA, Goldberg EM, Maroof AM, Xu Q, Petros TJ, Anderson SA. Tyson JA, et al. Development. 2015 Apr 1;142(7):1267-78. doi: 10.1242/dev.111526. Development. 2015. PMID: 25804737 Free PMC article. - Enhanced derivation of mouse ESC-derived cortical interneurons by expression of Nkx2.1.
Petros TJ, Maurer CW, Anderson SA. Petros TJ, et al. Stem Cell Res. 2013 Jul;11(1):647-56. doi: 10.1016/j.scr.2013.02.009. Epub 2013 Apr 1. Stem Cell Res. 2013. PMID: 23672829 Free PMC article. - Differentiation of Mouse Embryonic Stem Cells into Cortical Interneuron Precursors.
Tischfield DJ, Anderson SA. Tischfield DJ, et al. J Vis Exp. 2017 Dec 3;(130):56358. doi: 10.3791/56358. J Vis Exp. 2017. PMID: 29286389 Free PMC article. - Generation of cerebral cortical GABAergic interneurons from pluripotent stem cells.
Fitzgerald M, Sotuyo N, Tischfield DJ, Anderson SA. Fitzgerald M, et al. Stem Cells. 2020 Nov;38(11):1375-1386. doi: 10.1002/stem.3252. Epub 2020 Sep 2. Stem Cells. 2020. PMID: 32638460 Review. - Generating GABAergic cerebral cortical interneurons from mouse and human embryonic stem cells.
Goulburn AL, Stanley EG, Elefanty AG, Anderson SA. Goulburn AL, et al. Stem Cell Res. 2012 May;8(3):416-26. doi: 10.1016/j.scr.2011.12.002. Epub 2011 Dec 13. Stem Cell Res. 2012. PMID: 22280980 Review. No abstract available.
Cited by
- Duration of culture and sonic hedgehog signaling differentially specify PV versus SST cortical interneuron fates from embryonic stem cells.
Tyson JA, Goldberg EM, Maroof AM, Xu Q, Petros TJ, Anderson SA. Tyson JA, et al. Development. 2015 Apr 1;142(7):1267-78. doi: 10.1242/dev.111526. Development. 2015. PMID: 25804737 Free PMC article. - The Microtubule Regulator NEK7 Coordinates the Wiring of Cortical Parvalbumin Interneurons.
Hinojosa AJ, Deogracias R, Rico B. Hinojosa AJ, et al. Cell Rep. 2018 Jul 31;24(5):1231-1242. doi: 10.1016/j.celrep.2018.06.115. Cell Rep. 2018. PMID: 30067978 Free PMC article. - Progress in cell grafting therapy for temporal lobe epilepsy.
Shetty AK. Shetty AK. Neurotherapeutics. 2011 Oct;8(4):721-35. doi: 10.1007/s13311-011-0064-y. Neurotherapeutics. 2011. PMID: 21892793 Free PMC article. Review. - Use of "MGE enhancers" for labeling and selection of embryonic stem cell-derived medial ganglionic eminence (MGE) progenitors and neurons.
Chen YJ, Vogt D, Wang Y, Visel A, Silberberg SN, Nicholas CR, Danjo T, Pollack JL, Pennacchio LA, Anderson S, Sasai Y, Baraban SC, Kriegstein AR, Alvarez-Buylla A, Rubenstein JL. Chen YJ, et al. PLoS One. 2013 May 1;8(5):e61956. doi: 10.1371/journal.pone.0061956. Print 2013. PLoS One. 2013. PMID: 23658702 Free PMC article. - Effects of atelocollagen on neural stem cell function and its migrating capacity into brain in psychiatric disease model.
Yoshinaga T, Hashimoto E, Ukai W, Ishii T, Shirasaka T, Kigawa Y, Tateno M, Kaneta H, Watanabe K, Igarashi T, Kobayashi S, Sohma H, Kato T, Saito T. Yoshinaga T, et al. J Neural Transm (Vienna). 2013 Oct;120(10):1491-8. doi: 10.1007/s00702-013-1010-4. Epub 2013 Apr 6. J Neural Transm (Vienna). 2013. PMID: 23563790
References
- Anderson SA, Marín O, Horn C, Jennings K, Rubenstein JL. Distinct cortical migrations from the medial and lateral ganglionic eminences. Development. 2001;128:353–363. - PubMed
- Ascoli GA, Alonso-Nanclares L, Anderson SA, Barrionuevo G, Benavides-Piccione R, Burkhalter A, Buzsáki G, Cauli B, Defelipe J, Fairén A, Feldmeyer D, Fishell G, Fregnac Y, Freund TF, Gardner D, Gardner EP, Goldberg JH, Helmstaedter M, Hestrin S, Karube F, et al. Petilla terminology: nomenclature of features of GABAergic interneurons of the cerebral cortex. Nat Rev Neurosci. 2008;9:557–568. - PMC - PubMed
- Butt SJ, Fuccillo M, Nery S, Noctor S, Kriegstein A, Corbin JG, Fishell G. The temporal and spatial origins of cortical interneurons predict their physiological subtype. Neuron. 2005;48:591–604. - PubMed
Publication types
MeSH terms
Grants and funding
- K02 MH070031/MH/NIMH NIH HHS/United States
- K02 MH070031-07/MH/NIMH NIH HHS/United States
- R01 MH066912/MH/NIMH NIH HHS/United States
- R01 MH066912-07/MH/NIMH NIH HHS/United States
LinkOut - more resources
Full Text Sources
Other Literature Sources
Molecular Biology Databases


