The output of Hedgehog signaling is controlled by the dynamic association between Suppressor of Fused and the Gli proteins - PubMed (original) (raw)
The output of Hedgehog signaling is controlled by the dynamic association between Suppressor of Fused and the Gli proteins
Eric W Humke et al. Genes Dev. 2010.
Abstract
The transcriptional program orchestrated by Hedgehog signaling depends on the Gli family of transcription factors. Gli proteins can be converted to either transcriptional activators or truncated transcriptional repressors. We show that the interaction between Gli3 and Suppressor of Fused (Sufu) regulates the formation of either repressor or activator forms of Gli3. In the absence of signaling, Sufu restrains Gli3 in the cytoplasm, promoting its processing into a repressor. Initiation of signaling triggers the dissociation of Sufu from Gli3. This event prevents formation of the repressor and instead allows Gli3 to enter the nucleus, where it is converted into a labile, differentially phosphorylated transcriptional activator. This key dissociation event depends on Kif3a, a kinesin motor required for the function of primary cilia. We propose that the Sufu-Gli3 interaction is a major control point in the Hedgehog pathway, a pathway that plays important roles in both development and cancer.
Figures
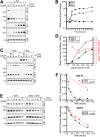
Figure 1.
Hh signaling decreases the stability of Gli3FL but not Gli3R. (A,B) NIH3T3 cells were treated with Shh, and levels of Gli3FL, Gli3R, Gli1, and Ptc1 protein (A) and RNA (B) were assayed by immunoblotting and quantitative RT–PCR, respectively. Levels of Gli1 and Ptc1, two Hh target genes, served as a metric of pathway activation, and the p38 protein was a loading control. (C,D) Levels of Gli1, Gli3FL, Gli3R, and p38 proteins in lysates of NIH3T3 cells treated with Fsk alone at the indicated concentrations or Shh + Fsk for 11 h. Protein levels quantitated by densitometry were plotted in D, along with the ratio of the Gli3FL/Gli3R signal (red). (E,F) Gli3FL, Gli3R, Sufu, and p38 protein levels in NIH3T3 cells treated with cycloheximide (CHX; 100 μg/mL) alone or cycloheximide plus SAG (CHX + SAG; 100 nM) for the indicated periods of time. Different exposures were needed for Gli3FL and Gli3R to avoid saturation of the signal; equivalent exposures are shown in Supplemental Figure S1A. The fraction of Gli3FL and Gli3R remaining (cf. t = 0) is plotted in F.
Figure 2.
Sufu stabilizes Gli3FL. (A) Levels of Gli3FL, Gli3R, Sufu, Gli1 (to assess target gene activation), and p38 (to ensure equal loading) were assayed in _Sufu_−/− cells infected with an empty retrovirus (vector) or with a retrovirus carrying either full-length Sufu or YFP-tagged Sufu. Cells were untreated or treated with SAG (100 nM; 12 h). (B) Anti-Gli3 immunoprecipitates from whole-cell lysates of _sufu_−/− cells or _sufu_−/− cells rescued with Sufu re-expression (_sufu_−/−:Sufu cells) were tested for the presence of Gli3 and Sufu protein by immunoblotting. (C,D) Gli3FL and Gli3R half-life in the presence or absence or Sufu was measured by treating _sufu_−/−:vector cells and _sufu_−/−:Sufu cells with cycloheximide (CHX; 100 μg/mL) for the indicated periods of time and then analyzing Gli3FL and Gli3R levels by immunoprecipitation (IP) from whole-cell lysates. Different exposures were necessary for samples from _sufu_−/−:vector and _sufu_−/−:Sufu cells to prevent signal saturation; equivalent exposures are shown in Supplemental Figure S2A. The fraction of Gli3FL remaining (cf. t = 0) in the two cell types is plotted in D. (E) Gli3FL protein levels in _sufu_−/− cells increase when the proteasome is inhibited with epoxomycin (10 μM; 6 h).
Figure 3.
Sufu promotes the synthesis but does not affect the degradation of Gli3R. (A) Fraction of Gli3R remaining in either _sufu_−/−:vector cells or _sufu_−/−:Sufu cells after treatment with cycloheximide (CHX; 100 μg/mL). (B,C) Analysis of Gli3 and Sufu protein levels in _sufu_−/− cells transiently transfected (72 h) with Myc-Gli3R (B) or Myc-Gli3FL (C), either alone or in combination with HA-tagged Sufu. (D) Gli3FL and Gli3R levels from C were quantitated by densitometry and used to calculate the Gli3FL/Gli3R ratio. (E) Levels of Gli3FL and Gli3R are much higher in _sufu_−/−:Sufu cells compared with _sufu_−/−:vector cells under the treatment conditions listed (6 h; SAG, 100 nM; Fsk, 20 μM). Since the signal from _sufu_−/−:Sufu samples is saturated, a lower exposure is shown in Supplemental Figure S3C. (F) RNA levels of the Hh target genes Gli1 or Ptc1 measured by quantitative RT–PCR in _sufu_−/− cells treated with Fsk (20 μM). (G,H) Lysates from NIH3T3 cells (shown in G) were incubated with control beads (anti-GFP), anti-Gli3 beads, or anti-Sufu beads, and the amount of Gli3 and Sufu captured was determined by immunoblotting. (H) Only Gli3FL but not Gli3R is coprecipitated with YFP-Sufu from lysates of _sufu_−/−:YFP-Sufu cells incubated with anti-YFP beads. In G and H, all of the lanes are at equivalent exposures from the same immunoblot; light-gray lines separate nonadjacent lanes that have been juxtaposed for clarity.
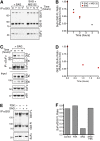
Figure 4.
Hh signaling promotes the dissociation of Sufu from Gli3FL and Gli2FL. (A) A time-dependent decrease in the amount of Sufu that coprecipitates with Gli3 from lysates of NIH3T3 cells treated with SAG alone (100 nM) or SAG + MG132 (25 μM). MG132 was added 30 min before SAG. (B) A time-dependent decrease in the amount of Sufu pulled down per unit of Gli3FL, estimated using the ratio of the Sufu signal to the Gli3FL signal from A. (C,D) A time-dependent decrease in the amount of Gli2FL that coprecipitates with anti-Sufu beads from lysates of NIH3T3 cells treated with SAG (100 nM) for the indicated periods of time. (E,F) Fsk (20 μM) prevents the SAG-induced dissociation (100 nM; 6 h) of Sufu from Gli3, assayed by determining the amount of Sufu that coprecipitated with anti-Gli3 beads from NIH3T3 lysates (shown in E). (F) The ratio of the Sufu signal to the Gli3FL signal from E was plotted.
Figure 5.
Hh signaling promotes the nuclear translocation, phosphorylation, and degradation of Gli3FL. (A) Subcellular fractionation reveals that Gli3FL, Sufu, and p38 are localized predominantly in the cytoplasm (C) while Gli3R is localized in the nucleus (N). Total (T) denotes a whole-cell extract. (B) NIH3T3 cells were left untreated, treated with SAG alone (100 nM), or SAG + MG132 (25 μM) for 2 h. Gli3FL, Gli3R, and Sufu protein levels were determined separately in nuclear (N) and cytoplasmic (C) fractions. In this and subsequent experiments, Lamin A (L-A) and p38 serve as control nuclear and cytoplasmic proteins to assess the quality of the fractionation. The fraction of Gli3FL in the cytoplasm or nucleus for each of the conditions shown in B is plotted in C. (D,E) Time courses showing changes in Gli3FL and Gli3R levels in the nucleus or the cytoplasm after stimulation with SAG (100 nM). Gli3FL and Gli3R levels from the immunoblot in D are plotted in E. (F) The electrophoretic mobility of Gli3FL present in the nucleus is slower after SAG treatment (100 nM, 2 h) when assessed on a 5% SDS-PAGE gel run for 12 h at 4°C. (G) Gels (3.5% acrylamide/0.5% agarose) without (left) or with (right) Mn+2-Phos-tag acrylamide show that the presence of Phos-tag retards the electrophoretic mobility of Gli3FL. (H) The mobility of Gli3FL in the nuclear and cytoplasmic fractions of cells treated with SAG (100 nM; 2 h) or left untreated. Each sample was treated with λ phosphatase (+) or a buffer control (−) to assess for phosphorylation. (Bottom) To easily visualize differences in mobility, the signal in each lane was plotted as a function of position.
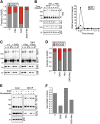
Figure 6.
PKA activation blocks the nuclear translocation of Gli3FL. (A) Fsk (20 μM) blocks the SAG-induced translocation of Gli3FL from the cytoplasm to the nucleus. The plots are derived from immunoblots shown in Supplemental Figure S6A (B) NIH3T3 cells were treated with Fsk (10 μM) + Shh at t = 0, Gli3FL and Gli3R proteins levels were measured by immunoblotting (left), and target gene transcription was assessed by Gli1 and Ptc1 mRNA levels measured by quantitative RT–PCR (right). Nocodazole (15 μM) blocks SAG-induced (100 nM, 3 h) phosphorylation (C), nuclear translocation (C,D), and degradation (E) of Gli3FL. However, nocodazole cannot prevent the SAG-triggered dissociation of Sufu from Gli3FL, assayed with an anti-Gli3 IP (E, right panel) and quantitated as the amount of Sufu pulled down per unit of Gli3FL (F).
Figure 7.
Sufu prevents the nuclear translocation of Gli3FL. Immunoblot (A) and graph (B) of Gli3FL from the subcellular fractionation of _sufu_−/− cells untreated or treated with MG132 (25 μM; 4 h). (C,D) Immunoblot (C) and graph (D) showing levels of total (T), cytoplasmic (C), and nuclear (N) Gli3FL in sufu−/−:vector cells or sufu−/−:Sufu cells. While the Gli3FL stabilized by MG132 in A was located in the nucleus, the Gli3 stabilized by Sufu readditon is located in the cytoplasm.
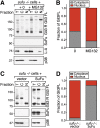
Figure 8.
Kif3a is required for Hh-induced dissociation of the Sufu–Gli3FL complex and nuclear translocation of Gli3FL. (A,B) Subcellular fractions generated from kif3a+/+ or _kif3a_−/− cells left untreated or treated with SAG (100 nM; 2 h) were assayed for Gli3FL, Gli3R, and Kif3a levels. (C,D) The amount of Sufu detected in Gli3 immunoprecipitates is unaffected by SAG treatment (100 nM; 2 h) in _kif3a_−/− cells, but drops significantly with SAG treatment in kif3a+/+ cells, seen both in the immunoblots (C) and by changes in the Sufu/Gli3FL ratio (D).
Figure 9.
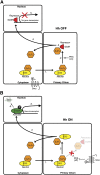
A model for how Sufu association controls the formation of Gli3R and Gli3A. (A) Gli3FL is complexed with Sufu in the cytoplasm and is maintained in a neutral state. Without the Hh signal (Hh OFF), the Sufu–Gli3 complex is recruited to cilia (1), leading to the efficient processing of Gli3FL into Gli3R (2). Gli3R formation leads to its dissociation from Sufu (3), allowing Gli3R to translocate into the nucleus (4), and repress Hh target genes (5). (B) When Hh signaling is initiated (Hh ON), Sufu dissociates from Gli3FL (3). This has two consequences. First, Gli3R production is halted (2). Second, free Gli3FL translocates to the nucleus (4), where it is phosphorylated, destabilized (6), and converted to a transcriptional activator (5). The level of PKA activity in the cilium may control the relative flux between pathways leading to Gli3R or Gli3A formation.
Similar articles
- Suppressor of fused controls mid-hindbrain patterning and cerebellar morphogenesis via GLI3 repressor.
Kim JJ, Gill PS, Rotin L, van Eede M, Henkelman RM, Hui CC, Rosenblum ND. Kim JJ, et al. J Neurosci. 2011 Feb 2;31(5):1825-36. doi: 10.1523/JNEUROSCI.2166-10.2011. J Neurosci. 2011. PMID: 21289193 Free PMC article. - Cilium-independent regulation of Gli protein function by Sufu in Hedgehog signaling is evolutionarily conserved.
Chen MH, Wilson CW, Li YJ, Law KK, Lu CS, Gacayan R, Zhang X, Hui CC, Chuang PT. Chen MH, et al. Genes Dev. 2009 Aug 15;23(16):1910-28. doi: 10.1101/gad.1794109. Genes Dev. 2009. PMID: 19684112 Free PMC article. - Suppressor of Fused Chaperones Gli Proteins To Generate Transcriptional Responses to Sonic Hedgehog Signaling.
Zhang Z, Shen L, Law K, Zhang Z, Liu X, Hua H, Li S, Huang H, Yue S, Hui CC, Cheng SY. Zhang Z, et al. Mol Cell Biol. 2017 Jan 19;37(3):e00421-16. doi: 10.1128/MCB.00421-16. Print 2017 Feb 1. Mol Cell Biol. 2017. PMID: 27849569 Free PMC article. - A mechanism for vertebrate Hedgehog signaling: recruitment to cilia and dissociation of SuFu-Gli protein complexes.
Tukachinsky H, Lopez LV, Salic A. Tukachinsky H, et al. J Cell Biol. 2010 Oct 18;191(2):415-28. doi: 10.1083/jcb.201004108. J Cell Biol. 2010. PMID: 20956384 Free PMC article. - Variations in Hedgehog signaling: divergence and perpetuation in Sufu regulation of Gli.
Ruel L, Thérond PP. Ruel L, et al. Genes Dev. 2009 Aug 15;23(16):1843-8. doi: 10.1101/gad.1838109. Genes Dev. 2009. PMID: 19684109 Free PMC article.
Cited by
- The mechanisms of Hedgehog signalling and its roles in development and disease.
Briscoe J, Thérond PP. Briscoe J, et al. Nat Rev Mol Cell Biol. 2013 Jul;14(7):416-29. doi: 10.1038/nrm3598. Epub 2013 May 30. Nat Rev Mol Cell Biol. 2013. PMID: 23719536 Review. - Suppressor of Fused Is Required for Determining Digit Number and Identity via Gli3/Fgfs/Gremlin.
Li J, Wang Q, Cui Y, Yang X, Li Y, Zhang X, Qiu M, Zhang Z, Zhang Z. Li J, et al. PLoS One. 2015 May 22;10(5):e0128006. doi: 10.1371/journal.pone.0128006. eCollection 2015. PLoS One. 2015. PMID: 26001200 Free PMC article. - Structural basis of Smoothened regulation by its extracellular domains.
Byrne EFX, Sircar R, Miller PS, Hedger G, Luchetti G, Nachtergaele S, Tully MD, Mydock-McGrane L, Covey DF, Rambo RP, Sansom MSP, Newstead S, Rohatgi R, Siebold C. Byrne EFX, et al. Nature. 2016 Jul 28;535(7613):517-522. doi: 10.1038/nature18934. Epub 2016 Jul 20. Nature. 2016. PMID: 27437577 Free PMC article. - Context-dependent ciliary regulation of hedgehog pathway repression in tissue morphogenesis.
Hwang SH, White KA, Somatilaka BN, Wang B, Mukhopadhyay S. Hwang SH, et al. PLoS Genet. 2023 Nov 9;19(11):e1011028. doi: 10.1371/journal.pgen.1011028. eCollection 2023 Nov. PLoS Genet. 2023. PMID: 37943875 Free PMC article. - Interaction between the TP63 and SHH pathways is an important determinant of epidermal homeostasis.
Chari NS, Romano RA, Koster MI, Jaks V, Roop D, Flores ER, Teglund S, Sinha S, Gruber W, Aberger F, Medeiros LJ, Toftgard R, McDonnell TJ. Chari NS, et al. Cell Death Differ. 2013 Aug;20(8):1080-8. doi: 10.1038/cdd.2013.41. Epub 2013 May 17. Cell Death Differ. 2013. PMID: 23686138 Free PMC article.
References
- Aza-Blanc P, Ramirez-Weber FA, Laget MP, Schwartz C, Kornberg TB. Proteolysis that is inhibited by hedgehog targets Cubitus interruptus protein to the nucleus and converts it to a repressor. Cell. 1997;89:1043–1053. - PubMed
- Barzi M, Berenguer J, Menendez A, Alvarez-Rodriguez R, Pons S. Sonic-hedgehog-mediated proliferation requires the localization of PKA to the cilium base. J Cell Sci. 2010;123:62–69. - PubMed
- Chen CH, von Kessler DP, Park W, Wang B, Ma Y, Beachy PA. Nuclear trafficking of Cubitus interruptus in the transcriptional regulation of Hedgehog target gene expression. Cell. 1999;98:305–316. - PubMed
Publication types
MeSH terms
Substances
Grants and funding
- HHMI/Howard Hughes Medical Institute/United States
- K99 CA129174/CA/NCI NIH HHS/United States
- R00 CA129174/CA/NCI NIH HHS/United States
- K99/ROO CA129174/CA/NCI NIH HHS/United States
LinkOut - more resources
Full Text Sources
Other Literature Sources
Molecular Biology Databases
Miscellaneous
