A palette of fluorescent probes with varying emission colors for imaging hydrogen peroxide signaling in living cells - PubMed (original) (raw)
A palette of fluorescent probes with varying emission colors for imaging hydrogen peroxide signaling in living cells
Bryan C Dickinson et al. J Am Chem Soc. 2010.
Abstract
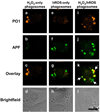
We present a new family of fluorescent probes with varying emission colors for selectively imaging hydrogen peroxide (H(2)O(2)) generated at physiological cell signaling levels. This structurally homologous series of fluorescein- and rhodol-based reporters relies on a chemospecific boronate-to-phenol switch to respond to H(2)O(2) over a panel of biologically relevant reactive oxygen species (ROS) with tunable excitation and emission maxima and sensitivity to endogenously produced H(2)O(2) signals, as shown by studies in RAW264.7 macrophages during the phagocytic respiratory burst and A431 cells in response to EGF stimulation. We further demonstrate the utility of these reagents in multicolor imaging experiments by using one of the new H(2)O(2)-specific probes, Peroxy Orange 1 (PO1), in conjunction with the green-fluorescent highly reactive oxygen species (hROS) probe, APF. This dual-probe approach allows for selective discrimination between changes in H(2)O(2) and hypochlorous acid (HOCl) levels in live RAW264.7 macrophages. Moreover, when macrophages labeled with both PO1 and APF were stimulated to induce an immune response, we discovered three distinct types of phagosomes: those that generated mainly hROS, those that produced mainly H(2)O(2), and those that possessed both types of ROS. The ability to monitor multiple ROS fluxes simultaneously using a palette of different colored fluorescent probes opens new opportunities to disentangle the complex contributions of oxidation biology to living systems by molecular imaging.
Figures
Figure 1
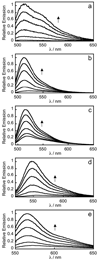
Fluorescence turn-on response of 5 µM PF2 (a), PF3 (b), PE1 (c), PY1 (d) or PO1 (e) to H2O2. Data were acquired at 25 °C in 20 mM HEPES, pH 7, with excitation at λ = 488 nm for PF2 and PF3, λ = 490 nm for PE1, λ = 514 nm for PY1, and λ = 540 nm for PO1. Emission was collected between 493 and 750 nm for PF2 and PF3, 495 and 750 nm for PE1, 520 and 750 nm for PY1 and 545 and 750 nm for PO1. Time points represent 0, 5, 15, 30, 45, and 60 minutes after the addition of 100 µM H2O2. Reactions are not complete at these time points. Full turn-on response of each probe is shown in Fig. S1.
Figure 2
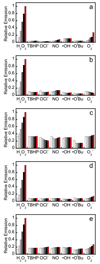
Fluorescence responses of 5 µM PF2 (a), PF3 (b), PE1 (c), PY1 (d) and PO1 (e) to various reactive oxygen species (ROS). Bars represent relative responses at 0, 5, 15, 30, 45, and 60 min after addition of each ROS. Data shown are for 200 µM NO and 100 µM for all other ROS. Data were acquired at 25 °C in 20 mM HEPES, pH 7, with excitation at λ = 488 nm for PF2 and PF3, λ = 490 nm for PE1, λ = 514 nm for PY1, and λ = 540 nm for PO1. Emission was collected between 493 and 750 nm for PF2 and PF3, 495 and 750 nm for PE1, 520 and 750 nm for PY1 and 545 and 750 nm for PO1. Time points represent 0, 5, 15, 30, 45, and 60 minutes after the addition of 100 µM H2O2. Reactions are not complete at these time points.
Figure 3
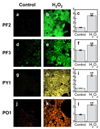
Confocal fluorescence images of H2O2 in live A431 cells under oxidative stress with PF2, PF3-Ac, PY1 and PO1. A431 cells incubated with 10 µM PF2 for 40 min at 37 °C (a). A431 cells incubated with 10 µM PF2 for 40 min at 37 °C with 100 µM H2O2 added for the final 20 min (b) and quantification (c). A431 cells incubated with 5 µM PF3-Ac for 40 min at 37 °C (d). A431 cells incubated with 5 µM PF3-Ac for 40 min at 37 °C with 100 µM H2O2 added for the final 20 min (e) and quantification (f). A431 cells incubated with 5 µM PY1 for 40 min at 37 °C (g). A431 cells incubated with 5 µM PY1 for 40 min at 37 °C with 100 µM H2O2 added for the final 20 min (h) and quantification (i). A431 cells incubated with 5 µM PO1 for 40 min at 37 °C (j). A431 cells incubated with 5 µM PO1 for 40 min at 37 °C with 100 µM H2O2 added for the final 20 min (k) and quantification (l). Data were normalized to controls and statistical analyses were performed with a two-tailed Student’s _t_-test (n = 4). **P ≤ 0.005 and error bars are ± s.e.m.
Figure 4
Confocal fluorescence images of PMA-induced H2O2 production in live RAW264.7 macrophages with PF2, PF3-Ac, PY1 and PO1. Macrophages incubated with 10 µM PF2 for 60 min at 37 °C (a). Macrophages incubated with 10 µM PF2 for 60 min at 37 °C with 1 µg/mL PMA added for the final 40 min (b) with a brightfield overlay (c) and quantification (d). Macrophages incubated with 5 µM PF3-Ac for 60 min at 37 °C (e). Macrophages incubated with 5 µM PF3-Ac for 60 min at 37 °C with 1 µg/mL PMA added for the final 40 min (f) with a brightfield overlay (g) and quantification (h). Macrophages incubated with 5 µM PY1 for 60 min at 37 °C (i). Macrophages incubated with 5 µM PY1 for 60 min at 37 °C with 1 µg/mL PMA added for the final 40 min (j) with a brightfield overlay (k) and quantification (l). Macrophages incubated with 5 µM PO1 for 60 min at 37 °C (m). Macrophages incubated with 5 µM PO1 for 60 min at 37 °C with 1 µg/mL PMA added for the final 40 min (n) with a brightfield overlay (o) and quantification (p). Data were normalized to controls and statistical analyses were performed with a two-tailed Student’s _t_-test (n = 4). **P ≤ 0.005 and error bars are ± s.e.m.
Figure 5
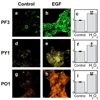
Confocal fluorescence images of EGF-induced H2O2 in live A431 cells with PF3-Ac, PY1 and PO1. A431 cells incubated with 5 µM PF3-Ac for 60 min at 37 °C (a). A431 cells incubated with 5 µM PF3-Ac for 60 min at 37 °C with 500 ng/mL EGF added for the final 40 min (b) and quantification (c). A431 cells incubated with 5 µM PY1 for 60 min at 37 °C (d). A431 cells incubated with 5 µM PY1 for 60 min at 37 °C with 500 ng/mL EGF added for the final 40 min (e) and quantification (f). A431 cells incubated with 5 µM PO1 for 60 min at 37 °C (g). A431 cells incubated with 5 µM PO1 for 60 min at 37 °C with 500 ng/mL EGF added for the final 20 min (h) and quantification (i). Data were normalized to controls and statistical analyses were performed with a two-tailed Student’s _t_-test (n = 4). *P ≤ 0.05, **P ≤ 0.005 and error bars are ± s.e.m.
Figure 6
Confocal fluorescence images of PMA-induced ROS production in live RAW264.7 macrophages with PO1 and APF simultaneously. Macrophages incubated with 5 µM PO1 and 5 µM APF for 40 min at 37 °C and imaged for PO1 (a) and APF (b). Macrophages incubated with 5 µM PO1 and 5 µM APF for 40 min at 37 °C with 50 µM H2O2 added for the final 20 min and imaged for PO1 (c) and APF (d). Macrophages incubated with 5 µM PO1 and 5 µM APF for 40 min at 37 °C with 100 µM HOCl added for the final 20 min and imaged for PO1 (e) and APF (f). Macrophages incubated with 5 µM PO1 and 5 µM APF for 40 min at 37 °C with 1 µg/mL PMA added for the final 20 min and imaged for PO1 (g) and APF (h). Quantification of a–h (i). Data were normalized to controls and statistical analyses were performed with a two-tailed Student’s _t_-test (n = 4). **P ≤ 0.005 and error bars are ± s.e.m.
Figure 7
Confocal fluorescence images of different types of phagosomes in live RAW264.7 macrophages distinguished by PO1 and APF. A macrophage producing mostly H2O2 as shown by the PO1 signal (a), APF signal (b), overlay (c) and brightfield (d). A macrophage producing mostly hROS as shown by the PO1 signal (e), APF signal (f), overlay (g) and brightfield (h). A macrophage producing a mixture of H2O2 phagosomes, hROS phagosomes, and H2O2 and hROS phagosomes. as shown by the PO1 signal (i), APF signal (j), overlay (k) and brightfield (l). 10 µm scale bar shown.
Scheme 1
Boronate-based H2O2-specific fluorescent indicators.
Scheme 2
Synthesis and activation of PF2, PF3, and PE1.
Scheme 3
Synthesis and activation of PY1 and PO1.
Similar articles
- Boronate oxidation as a bioorthogonal reaction approach for studying the chemistry of hydrogen peroxide in living systems.
Lippert AR, Van de Bittner GC, Chang CJ. Lippert AR, et al. Acc Chem Res. 2011 Sep 20;44(9):793-804. doi: 10.1021/ar200126t. Epub 2011 Aug 11. Acc Chem Res. 2011. PMID: 21834525 Free PMC article. - A red-emitting naphthofluorescein-based fluorescent probe for selective detection of hydrogen peroxide in living cells.
Albers AE, Dickinson BC, Miller EW, Chang CJ. Albers AE, et al. Bioorg Med Chem Lett. 2008 Nov 15;18(22):5948-50. doi: 10.1016/j.bmcl.2008.08.035. Epub 2008 Aug 14. Bioorg Med Chem Lett. 2008. PMID: 18762422 Free PMC article. - Boronate-based fluorescent probes: imaging hydrogen peroxide in living systems.
Lin VS, Dickinson BC, Chang CJ. Lin VS, et al. Methods Enzymol. 2013;526:19-43. doi: 10.1016/B978-0-12-405883-5.00002-8. Methods Enzymol. 2013. PMID: 23791092 Free PMC article. Review. - Sensitive detection and estimation of cell-derived peroxynitrite fluxes using fluorescein-boronate.
Rios N, Piacenza L, Trujillo M, Martínez A, Demicheli V, Prolo C, Álvarez MN, López GV, Radi R. Rios N, et al. Free Radic Biol Med. 2016 Dec;101:284-295. doi: 10.1016/j.freeradbiomed.2016.08.033. Epub 2016 Sep 15. Free Radic Biol Med. 2016. PMID: 27641237 - Boronate can be the fluorogenic switch for the detection of hydrogen peroxide.
Sun W, Wu J, Li J, Fang H, Du L, Li M. Sun W, et al. Curr Med Chem. 2012;19(21):3622-34. doi: 10.2174/092986712801323270. Curr Med Chem. 2012. PMID: 22612709 Review.
Cited by
- Reaction-based small-molecule fluorescent probes for chemoselective bioimaging.
Chan J, Dodani SC, Chang CJ. Chan J, et al. Nat Chem. 2012 Dec;4(12):973-84. doi: 10.1038/nchem.1500. Nat Chem. 2012. PMID: 23174976 Free PMC article. Review. - Fluorescent probes for monitoring myeloperoxidase-derived hypochlorous acid: a comparative study.
Pierzchała K, Pięta M, Rola M, Świerczyńska M, Artelska A, Dębowska K, Podsiadły R, Pięta J, Zielonka J, Sikora A, Marcinek A, Michalski R. Pierzchała K, et al. Sci Rep. 2022 Jun 3;12(1):9314. doi: 10.1038/s41598-022-13317-8. Sci Rep. 2022. PMID: 35660769 Free PMC article. - Screening Biophysical Sensors and Neurite Outgrowth Actuators in Human Induced-Pluripotent-Stem-Cell-Derived Neurons.
Pai VP, Cooper BG, Levin M. Pai VP, et al. Cells. 2022 Aug 9;11(16):2470. doi: 10.3390/cells11162470. Cells. 2022. PMID: 36010547 Free PMC article. - Probing oxidative stress: Small molecule fluorescent sensors of metal ions, reactive oxygen species, and thiols.
Hyman LM, Franz KJ. Hyman LM, et al. Coord Chem Rev. 2012 Oct 1;256(19-20):2333-2356. doi: 10.1016/j.ccr.2012.03.009. Coord Chem Rev. 2012. PMID: 23440254 Free PMC article. - Oncogene-induced reactive oxygen species fuel hyperproliferation and DNA damage response activation.
Ogrunc M, Di Micco R, Liontos M, Bombardelli L, Mione M, Fumagalli M, Gorgoulis VG, d'Adda di Fagagna F. Ogrunc M, et al. Cell Death Differ. 2014 Jun;21(6):998-1012. doi: 10.1038/cdd.2014.16. Epub 2014 Feb 28. Cell Death Differ. 2014. PMID: 24583638 Free PMC article.
References
- Floyd RA. Science. 1991;254:1597. - PubMed
- Giorgio M, Trinei M, Migliaccio E, Pelicci PG. Nat. Rev. Mol. Cell. Biol. 2007;8:722–728. - PubMed
- Zhang W, Wang T, Qin L, Gao HM, Wilson B, Ali SF, Hong JS, Liu B. FASEB J. 2004;18:589–591. - PubMed
- Finkel T, Serrano M, Blasco MA. Nature. 2007;448:767–774. - PubMed
Publication types
MeSH terms
Substances
Grants and funding
- R01 GM079465/GM/NIGMS NIH HHS/United States
- T32 GM066698/GM/NIGMS NIH HHS/United States
- HHMI/Howard Hughes Medical Institute/United States
- GM 79465/GM/NIGMS NIH HHS/United States
LinkOut - more resources
Full Text Sources
Other Literature Sources
