Candidate causal regulatory effects by integration of expression QTLs with complex trait genetic associations - PubMed (original) (raw)
Candidate causal regulatory effects by integration of expression QTLs with complex trait genetic associations
Alexandra C Nica et al. PLoS Genet. 2010.
Abstract
The recent success of genome-wide association studies (GWAS) is now followed by the challenge to determine how the reported susceptibility variants mediate complex traits and diseases. Expression quantitative trait loci (eQTLs) have been implicated in disease associations through overlaps between eQTLs and GWAS signals. However, the abundance of eQTLs and the strong correlation structure (LD) in the genome make it likely that some of these overlaps are coincidental and not driven by the same functional variants. In the present study, we propose an empirical methodology, which we call Regulatory Trait Concordance (RTC) that accounts for local LD structure and integrates eQTLs and GWAS results in order to reveal the subset of association signals that are due to cis eQTLs. We simulate genomic regions of various LD patterns with both a single or two causal variants and show that our score outperforms SNP correlation metrics, be they statistical (r(2)) or historical (D'). Following the observation of a significant abundance of regulatory signals among currently published GWAS loci, we apply our method with the goal to prioritize relevant genes for each of the respective complex traits. We detect several potential disease-causing regulatory effects, with a strong enrichment for immunity-related conditions, consistent with the nature of the cell line tested (LCLs). Furthermore, we present an extension of the method in trans, where interrogating the whole genome for downstream effects of the disease variant can be informative regarding its unknown primary biological effect. We conclude that integrating cellular phenotype associations with organismal complex traits will facilitate the biological interpretation of the genetic effects on these traits.
Conflict of interest statement
The authors have declared that no competing interests exist.
Figures
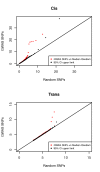
Figure 1. Excess of regulatory variants among GWAS signals.
QQ plot depicting the excess of significant regulatory signal in GWAS data (976 NHGRI SNPs). For both the cis and trans analyses, the −log10(P-value) of the best associations per SNP are plotted. In red, the distribution of these values for GWAS SNPs is compared to that of the median of 1,000 sets of 976 random SNPs with same MAF distribution. In black, the estimated upper limit of the 95% confidence interval is plotted.
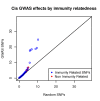
Figure 2. Cis regulatory enrichment stratified by immunity relatedness.
The −log10(P-value) of the best associations per GWAS SNPs and a set of random SNPs are plotted. As expected given the tissue (LCLs), immunity related phenotypes are mainly responsible for the enrichment.
Figure 3. RTC score distribution.
The RTC score is uniformly distributed for simulated eQTLs and dSNPs tagging two different causal variants in the same interval (left panel). The RTC Score is right-skewed for simulated eQTLs and dSNPs tagging the same functional variant (middle panel). The RTC score is sensitive to associations tagging a common functional variant in non-simulated data, when the GWAS trait is gene expression (GenCord LCL samples – right panel).
Figure 4. Properties of the RTC score when varying r2.
Simulation results depicting the relationship between the RTC score and the r2 (eQTL, dSNP) when they tag different causal SNPs (H0: left panel) versus one causal SNP (H1: right panel). The RTC increases as expected with increased r2 between the eQTL and the dSNP, but when tagging the same functional variant, various lower pairwise r2 combinations can determine a high RTC. This makes r2 on its own insufficient to detect shared causal effects.
Figure 5. RTC score properties when varying D'.
Simulation results depicting the relationship between the RTC score and the D' (eQTL, dSNP) when they tag different causal SNPs (H0: left panel) versus one causal SNP (H1: right panel). D' is not correlated with RTC, therefore it will not determine high scores on its own in the absence of a common functional variant. Under the H1, the majority of high RTC scoring pairs have high D', but in the case of a perfect historical correlation scenario, it's impossible to distinguish causal from coincidental effects with D' only.
Figure 6. RTC score properties when varying the median r2 of the hotspot interval.
Simulation results depicting the relationship between the RTC score and the local LD structure (median r2) under the null (different causal SNPs - left panel) and alternative hypothesis (same causal SNP - right panel). Under H0, the RTC score is evenly distributed, therefore intervals with overall low LD will not determine high RTC scores. Under H1, the RTC performs best in intervals with overall low LD, where the correlation between the eQTL and other non-disease SNPs decays much faster, making the dSNP correction stand out.
Figure 7. Overrepresentation of immunity-related high-scoring cis signals.
Distribution of best RTC Scores per GWAS SNP stratified by immunity relatedness. Histogram contains results from the analysis of 130 hotspot intervals with colocalizing disease SNPs and cis eQTLs. We observe a significant overrepresentation of high-scoring (RTC > = 0.9) candidate genes (black bars) for immunity related complex traits compared to non-immunity related ones (grey bars) (Fisher's Exact Test, P-value = 0.0125).
Figure 8. The RTC method compared to standard LD measurements in the observed data.
Neither r2 nor D' between the eQTL and the GWAS SNP are direct predictors of a high RTC Score. Highlighted here are the results from the cis and trans analyses. We obtain high scoring results (RTC Scores > = 0.8 in blue) for cases with a high correlation between the disease SNP and the eQTL as expected, but also for pairs with low statistical correlation (r2 – top panel). As shown in the bottom panel, many of these high scoring pairs are historically correlated (D' = 1), but so are many more by chance. Additionally, we can detect high scoring pairs with low D' as well. Hence, no obvious combination of the two LD measures can predict a high RTC Score.
Figure 9. The fraction of eQTL variance explained away by the dSNP versus the RTC score.
We contrast the LR adjusted R2 at the eQTL after and before correction of the dSNP and observe that while most high scoring pairs correspond to cases of lowest variance left unexplained, other interesting cases would be missed solely by using an arbitrary variance threshold.
Similar articles
- Estimating the causal tissues for complex traits and diseases.
Ongen H, Brown AA, Delaneau O, Panousis NI, Nica AC; GTEx Consortium; Dermitzakis ET. Ongen H, et al. Nat Genet. 2017 Dec;49(12):1676-1683. doi: 10.1038/ng.3981. Epub 2017 Oct 23. Nat Genet. 2017. PMID: 29058715 - Large-scale East-Asian eQTL mapping reveals novel candidate genes for LD mapping and the genomic landscape of transcriptional effects of sequence variants.
Narahara M, Higasa K, Nakamura S, Tabara Y, Kawaguchi T, Ishii M, Matsubara K, Matsuda F, Yamada R. Narahara M, et al. PLoS One. 2014 Jun 23;9(6):e100924. doi: 10.1371/journal.pone.0100924. eCollection 2014. PLoS One. 2014. PMID: 24956270 Free PMC article. - Integrated genome-wide analysis of expression quantitative trait loci aids interpretation of genomic association studies.
Joehanes R, Zhang X, Huan T, Yao C, Ying SX, Nguyen QT, Demirkale CY, Feolo ML, Sharopova NR, Sturcke A, Schäffer AA, Heard-Costa N, Chen H, Liu PC, Wang R, Woodhouse KA, Tanriverdi K, Freedman JE, Raghavachari N, Dupuis J, Johnson AD, O'Donnell CJ, Levy D, Munson PJ. Joehanes R, et al. Genome Biol. 2017 Jan 25;18(1):16. doi: 10.1186/s13059-016-1142-6. Genome Biol. 2017. PMID: 28122634 Free PMC article. - Determining causality and consequence of expression quantitative trait loci.
Battle A, Montgomery SB. Battle A, et al. Hum Genet. 2014 Jun;133(6):727-35. doi: 10.1007/s00439-014-1446-0. Epub 2014 Apr 26. Hum Genet. 2014. PMID: 24770875 Free PMC article. Review. - Regulatory SNPs: Altered Transcription Factor Binding Sites Implicated in Complex Traits and Diseases.
Degtyareva AO, Antontseva EV, Merkulova TI. Degtyareva AO, et al. Int J Mol Sci. 2021 Jun 16;22(12):6454. doi: 10.3390/ijms22126454. Int J Mol Sci. 2021. PMID: 34208629 Free PMC article. Review.
Cited by
- Cell-type, allelic, and genetic signatures in the human pancreatic beta cell transcriptome.
Nica AC, Ongen H, Irminger JC, Bosco D, Berney T, Antonarakis SE, Halban PA, Dermitzakis ET. Nica AC, et al. Genome Res. 2013 Sep;23(9):1554-62. doi: 10.1101/gr.150706.112. Epub 2013 May 28. Genome Res. 2013. PMID: 23716500 Free PMC article. - ncRNA-eQTL: a database to systematically evaluate the effects of SNPs on non-coding RNA expression across cancer types.
Li J, Xue Y, Amin MT, Yang Y, Yang J, Zhang W, Yang W, Niu X, Zhang HY, Gong J. Li J, et al. Nucleic Acids Res. 2020 Jan 8;48(D1):D956-D963. doi: 10.1093/nar/gkz711. Nucleic Acids Res. 2020. PMID: 31410488 Free PMC article. - Integrating a genome-wide association study with transcriptomic analysis to detect genes controlling grain drying rate in maize (Zea may, L.).
Jia T, Wang L, Li J, Ma J, Cao Y, Lübberstedt T, Li H. Jia T, et al. Theor Appl Genet. 2020 Feb;133(2):623-634. doi: 10.1007/s00122-019-03492-0. Epub 2019 Dec 3. Theor Appl Genet. 2020. PMID: 31797010 - Multi-omic insights into Parkinson's Disease: From genetic associations to functional mechanisms.
Schilder BM, Navarro E, Raj T. Schilder BM, et al. Neurobiol Dis. 2022 Feb;163:105580. doi: 10.1016/j.nbd.2021.105580. Epub 2021 Dec 4. Neurobiol Dis. 2022. PMID: 34871738 Free PMC article. Review. - Progress and promise of genome-wide association studies for human complex trait genetics.
Stranger BE, Stahl EA, Raj T. Stranger BE, et al. Genetics. 2011 Feb;187(2):367-83. doi: 10.1534/genetics.110.120907. Epub 2010 Nov 29. Genetics. 2011. PMID: 21115973 Free PMC article. Review.
References
- Eeles RA, Kote-Jarai Z, Giles GG, Olama AA, Guy M, et al. Multiple newly identified loci associated with prostate cancer susceptibility. Nat Genet. 2008;40:316–321. - PubMed
Publication types
MeSH terms
LinkOut - more resources
Full Text Sources
Other Literature Sources
Research Materials
Miscellaneous


