Small-molecule kinase inhibitors provide insight into Mps1 cell cycle function - PubMed (original) (raw)
doi: 10.1038/nchembio.345. Epub 2010 Apr 11.
Nannette Jelluma, Panagis Filippakopoulos, Meera Soundararajan, Michael S Manak, Mijung Kwon, Hwan Geun Choi, Taebo Sim, Quinn L Deveraux, Sabine Rottmann, David Pellman, Jagesh V Shah, Geert J P L Kops, Stefan Knapp, Nathanael S Gray
Affiliations
- PMID: 20383151
- PMCID: PMC2857554
- DOI: 10.1038/nchembio.345
Small-molecule kinase inhibitors provide insight into Mps1 cell cycle function
Nicholas Kwiatkowski et al. Nat Chem Biol. 2010 May.
Abstract
Mps1, a dual-specificity kinase, is required for the proper functioning of the spindle assembly checkpoint and for the maintenance of chromosomal stability. As Mps1 function has been implicated in numerous phases of the cell cycle, the development of a potent, selective small-molecule inhibitor of Mps1 should facilitate dissection of Mps1-related biology. We describe the cellular effects and Mps1 cocrystal structures of new, selective small-molecule inhibitors of Mps1. Consistent with RNAi studies, chemical inhibition of Mps1 leads to defects in Mad1 and Mad2 establishment at unattached kinetochores, decreased Aurora B kinase activity, premature mitotic exit and gross aneuploidy, without any evidence of centrosome duplication defects. However, in U2OS cells having extra centrosomes (an abnormality found in some cancers), Mps1 inhibition increases the frequency of multipolar mitoses. Lastly, Mps1 inhibitor treatment resulted in a decrease in cancer cell viability.
Figures
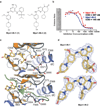
Figure 1. Mps1-IN-1 and Mps1-IN-2 inhibit Mps1 kinase activity and bind Mps1 in the ATP-binding site
(a) The chemical structures of two ATP-competitive Mps1 kinase inhibitors, Mps1-IN-1 and Mps1-IN-2, are derived from two scaffold series: pyrrolopyridine and pyrimidodiazepinone respectively. (b) In vitro kinase assays using the Lanthascreen technology were performed to assess the in vitro activity of compounds 1 and 2. 5 µg/mL Mps1 (∼ 40 nM) kinase were used in each reaction with 1 µM ATP (Km,app < 1 uM) and 200 nM AF-647 E4Y substrate. (c) Active site of Mps1 in complex with Mps1-IN-1 (upper panel) and the methoxy derivative of Mps1-IN-2 (methoxy-Mps1-IN-2 - lower panel). The most important residues interacting with the inhibitor are shown in stick representation and are labeled. The polyethylene glycol molecule coordinating the conserved active site lysine (K553) in the Mps1-IN-1 complex is also shown. Carbon atoms of Mps1-IN-1 and Mps1-IN-2 are shown in yellow to discriminate from Mps1 kinase residue side chains. (d) 2FoFc electron density map contoured at 2σ around the inhibitor molecules.
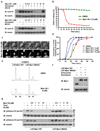
Figure 2. Mps1-IN-1 and Mps1-IN-2 Induce Bypass of a Checkpoint-mediated Mitotic Arrest
(a) Immunoblot of cyclin B from U2OS cells treated with Mps1 inhibitors. U2OS cells were arrested in mitosis by combination treatment of thymidine and nocodazole prior to treatment with nocodazole or co-administration with Mps1 inhibitor ± MG132 for 4 hrs. (b) Hela S3 cells expressing histone H2B-GFP were treated with nocodazole ± Mps1-IN-1. Cells were followed by immunofluorescence to determine exit from mitosis via nuclear envelope reassembly. 150 cells of each cell population were counted. (c) Selected frames from a time-lapse series of cells after treatment as in (b). Time is given in minutes:seconds. (d) Cumulative percentage of cells initiating anaphase. U2OS H2B–GFP cells were treated with DMSO or Mps1-IN-1 and imaged using fluorescence time-lapse microscopy. Time refers to the duration between nuclear envelope breakdown (NEBD) and anaphase initiation. 100 cells of each cell population were analyzed. (e) FACS analysis of UTRM10 cells expressing LAP-Mps1 WT or M602Q treated with Mps1-IN-1 or DMSO for 48 hrs. (f) Immunoblot showing induction of the RNAi-resistant LAP-tagged proteins. Clones were harvested and the relative levels of LAP-Mps1 in mitosis were compared to the UTRM10 parental cell line , . (g) Immunoblot of pHistone H3 in UTRM10 cells expressing LAP-Mps1 WT or M602Q after treatment with Mps1 inhibitors. UTRM10 cell lines arrested in mitosis by combination treatment of thymidine and taxol were treated with taxol ± inhibitor. All graphics were obtained from three independent experiments. Scale bars in C are 10 µm.
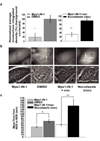
Figure 3. Mps1-IN-1 treatment causes disruption in recruitment of Mad2 to kinetochores
(a) Establishment of Mad2 at the kinetochores is dependent on Mps1 kinase activity when cells enter mitosis. PtK2 cells stably expressing HsMad2-EYFP were treated with either Mps1-IN-1 (10 µM) (N=29) or Mps1-IN-1 (10µM) and nocodazole (N=25) and then imaged entering mitosis. Corresponding controls were PtK2 cells stably expressing HsMad2-EYFP treated with DMSO (N=26) or treated with nocodazole only (N=20) and then imaged entering mitosis. Normalized average kinetochore density representing Mad2-EYFP at kinetochores was measured and background corrected for each experimental case and control. Error bars represent the 95% confidence interval of each data set (* p-value = 5.63e−09, ** p-value = 7.39−07, Student’s t test). (b) Representative images of PtK2 cells stably expressing HsMad2-EYFP that were treated as in (a). The top panel are images of HsMad2-EYFP fluorescence and the bottom panel are corresponding phase images. Scale bar is equal to 10 µm. (c) Inhibition of Mps1 kinase activity affects mitotic timing. Randomly cycling PtK2 cells stably expressing HsMad2-EYFP were treated with either Mps1-IN-1 (10 µM) (N=29) alone or with Mps1-IN-1 (10 µM) and nocodazole (N=25) and then imaged entering mitosis from nuclear envelope breakdown (NEB) through to nuclear envelope reassembly (NER). Untreated PtK2 cells (N=26) or those treated with nocodazole only (N=20) were also imaged. Average time spent in mitosis (from NEB to NER) is shown. Error bars represent the 95% confidence interval of each data set (* p< 2.23e−08, ** p<3.08−08, Student’s t test).
Figure 4. Mps1-IN-1 treatment decreases intracellular Aurora B kinase activity
(a) Schematic of the treatment regimen used to assess the effect of Mps1-IN-1 treatment on intracellular Aurora B kinase activity during taxol treatment in Hela and U2OS cells. (b) Mps1-IN-1 treatment decreases the phosphorylation of pHistone H3 (ser10), a direct substrate of Aurora B. Immunoblot of Hela and U2OS cells treated as described in (a). An antibody to pHistone H3 (ser10) was used to assess the kinase activity of Aurora B, while the mobility shift in Mps1 was used to assess the relative amount of Mps1 auto-phosphorylation. Cyclin B levels served as a mitotic marker. (c) Mps1-IN-1 treatment decreases the phosphorylation of Aurora B in its activation loop (Thr232). U2OS cells were treated as described in (a). An antibody to pAurora B (Thr232) was used to assess the phosphorylation of Aurora B, while the mobility shift in Mps1 was used to assess the relative amount of Mps1 auto-phosphorylation. Cyclin B levels served as a mitotic marker. Arrows indicate phosphorylation-induced shift of Mps1 total protein band. (d) In vitro kinase assay using the Lanthascreen technology was performed to assess the in vitro activity of Mps1-IN-1 on Aurora B. Aurora B kinase (5 nM) was used in each reaction with ATP at the apparent Km (63.7 nM) and the substrate, 30 nM Kinase Tracer 236.
Figure 5. Mps1-IN-1 compound treatment does not affect centrosome duplication
(a) Schematic of the treatment regimen used to assess the effect of Mps1-IN-1 treatment on centrosome duplication in Hela and U2OS cells. (b) Immunofluorescence images of U2OS cells treated with Mps1-IN-1 or doxycycline to induce Mps1 shRNA expression. Centrin, α-tubulin and DNA are shown in green, red and blue, respectively. Insets show high magnification images of centrin staining. (c) Mps1-IN-1 treatment does not affect centrosome number in cycling Hela S3 or U2OS cells. The centriole number of mitotic spindles from synchronized cycling cells treated with Mps1-IN-1 or DMSO was quantitated using centrin staining. Cells counted (1 and 2 cell cycles): Hela DMSO - 288 and 260 cells, Hela Mps1-IN-1 – 296 and 260 cells, U2OS DMSO - 300 and 234 cells, U2OS Mps1-IN-1 – 300 and 135 cells. (d) Immunoblot showing shRNA-mediated depletion of endogenous Mps1 in UTRM10 cells by doxycycline treatment. (e) Depletion of Mps1 does not affect centrosome number in UTRM10 cells. The centriole number of mitotic spindles from cycling cells treated with doxycycline for 72 hrs. was scored as in (c). 304 DMSO-treated mitotic cells and 267 doxycycline-treated mitotic cells were scored. (f) UTRM10 cells co-treated with hydroxyurea and either Mps1-IN-1, doxycycline, or DMSO vehicle for 48 hours were scored using centrin staining. Cells counted: DMSO – 443, Mps1-IN-1 10 µM/25 µM - 433/433, doxycycline - 485. All graphics represent mean ±SD and were obtained from three independent experiments. Scale bars in B are 10 µm.
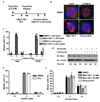
Figure 6. Mps1-IN-1 drives cancer cells with extra centrosomes into a catastrophic anaphase
(a) Doxycycline (Dox) inducible Plk4 overexpression induces extra centrosomes in U2OS cells. Metaphase spindles with 2 or more centrosomes (centros.) were quantified after treatment with doxycycline or DMSO by centrin staining. ∼300 spindles were scored. (b) Cells cluster extra centrosomes, passing through a multipolar intermediate before undergoing bipolar divisions. Immunofluorescence images of cells from (a). Centrin, α-tubulin and DNA are shown in green, red and blue, respectively. Insets show high magnification images of centrin staining. (c) Resolution of metaphase multipolar spindles into bipolar spindles in anaphase in cells with extra centrosomes. Quantitation of bipolar or multipolar spindles during metaphase, anaphase and telophases in cells with extra centrosomes. ∼300 spindles were scored. (d) Extra centrosomes lead to delays in anaphase onset in a Mps1 (SAC)-dependent manner. (e) In extra centrosomal cells, the abrogation of SAC by Mps1-IN-1 treatment induces multipolar anaphases/telophases (bottom panels), whereas SAC-dependent delay enables bipolar division in the absence of Mps1-IN-1 (upper panels). Timelapse still images taken from movies of U2OS H2B–GFP after Plk4 overexpression. Time is shown in minutes after NEBD. Cells were synchronized with double thymidine blocks and released for 6 hrs. prior to Mps1-IN-1 treatment. (f) Quantitation of bipolar or multipolar anaphases/telophases in (e). All graphics represent mean ±SD (*p-value = 7.11e−05, **p-value = 0.0011, *** p-value = 2.46e−07, **** p-value = 0.0024, Student’s t test, 3 independent experiments). Scale bars in B, E are equal to 10 µm.
Figure 7. Mps1 is required for cell viability
(a) HCT116 cells were treated with Mps1-IN-1 (2, 5, 10 µM) for 24, 48, 72, and 96 hours. Effects on cell proliferation were quantified by measuring fluorescence of Syto60 nucleic acid stain emitted at 695 nm (excitation 635 nm). Values were normalized to DMSO control for each time point. All graphics represent mean ± SD and were obtained from 4 independent experiments. (b) FACS profile of HCT116 cells treated with DMSO vehicle or Mps1-IN-1 (10 µM) for the indicated time points. (c) Colony outgrowth assay of HCT116 cells treated with DMSO vehicle or Mps1-IN-1 (2, 5, 10 µM). Cells were plated at a density of 200 cells/60-mm dish and harvested for crystal violet staining after 10 days. (d) Quantitation of colony outgrowth assays for HCT116 cells treated with DMSO vehicle or Mps1-IN-1 (2, 5, 10 µM). All graphics represent mean + SD and were obtained from 3 independent experiments (**p-value = 3.22e−05, Student’s t test). (e) Immunoblot of PARP cleavage of HCT116 cells treated with Mps1-IN-1 at the indicated concentrations. Cell lysates were harvested after 24, 48, and 72 hours for immunoblot detections.
Similar articles
- Chemical genetic inhibition of Mps1 in stable human cell lines reveals novel aspects of Mps1 function in mitosis.
Sliedrecht T, Zhang C, Shokat KM, Kops GJ. Sliedrecht T, et al. PLoS One. 2010 Apr 22;5(4):e10251. doi: 10.1371/journal.pone.0010251. PLoS One. 2010. PMID: 20422024 Free PMC article. - Monopolar spindle 1 (MPS1) kinase promotes production of closed MAD2 (C-MAD2) conformer and assembly of the mitotic checkpoint complex.
Tipton AR, Ji W, Sturt-Gillespie B, Bekier ME 2nd, Wang K, Taylor WR, Liu ST. Tipton AR, et al. J Biol Chem. 2013 Dec 6;288(49):35149-58. doi: 10.1074/jbc.M113.522375. Epub 2013 Oct 22. J Biol Chem. 2013. PMID: 24151075 Free PMC article. - Sustained Mps1 activity is required in mitosis to recruit O-Mad2 to the Mad1-C-Mad2 core complex.
Hewitt L, Tighe A, Santaguida S, White AM, Jones CD, Musacchio A, Green S, Taylor SS. Hewitt L, et al. J Cell Biol. 2010 Jul 12;190(1):25-34. doi: 10.1083/jcb.201002133. J Cell Biol. 2010. PMID: 20624899 Free PMC article. - Molecular design and anticancer activities of small-molecule monopolar spindle 1 inhibitors: A Medicinal chemistry perspective.
Wang S, Zhang M, Liang D, Sun W, Zhang C, Jiang M, Liu J, Li J, Li C, Yang X, Zhou X. Wang S, et al. Eur J Med Chem. 2019 Aug 1;175:247-268. doi: 10.1016/j.ejmech.2019.04.047. Epub 2019 Apr 20. Eur J Med Chem. 2019. PMID: 31121430 Review. - Development of MPS1 Inhibitors: Recent Advances and Perspectives.
Zeng Y, Ren X, Jin P, Zhang Y, Zhuo M, Wang J. Zeng Y, et al. J Med Chem. 2023 Dec 28;66(24):16484-16514. doi: 10.1021/acs.jmedchem.3c00963. Epub 2023 Dec 14. J Med Chem. 2023. PMID: 38095579 Review.
Cited by
- Mps1 promotes rapid centromere accumulation of Aurora B.
van der Waal MS, Saurin AT, Vromans MJ, Vleugel M, Wurzenberger C, Gerlich DW, Medema RH, Kops GJ, Lens SM. van der Waal MS, et al. EMBO Rep. 2012 Sep;13(9):847-54. doi: 10.1038/embor.2012.93. Epub 2012 Jun 26. EMBO Rep. 2012. PMID: 22732840 Free PMC article. - Connecting up and clearing out: how kinetochore attachment silences the spindle assembly checkpoint.
Kops GJ, Shah JV. Kops GJ, et al. Chromosoma. 2012 Oct;121(5):509-25. doi: 10.1007/s00412-012-0378-5. Epub 2012 Jul 11. Chromosoma. 2012. PMID: 22782189 Review. - Cdk1 and Plk1 mediate a CLASP2 phospho-switch that stabilizes kinetochore-microtubule attachments.
Maia AR, Garcia Z, Kabeche L, Barisic M, Maffini S, Macedo-Ribeiro S, Cheeseman IM, Compton DA, Kaverina I, Maiato H. Maia AR, et al. J Cell Biol. 2012 Oct 15;199(2):285-301. doi: 10.1083/jcb.201203091. Epub 2012 Oct 8. J Cell Biol. 2012. PMID: 23045552 Free PMC article. - Spindle assembly checkpoint-dependent mitotic delay is required for cell division in absence of centrosomes.
Farrell KC, Wang JT, Stearns T. Farrell KC, et al. Elife. 2024 Aug 2;12:RP84875. doi: 10.7554/eLife.84875. Elife. 2024. PMID: 39092485 Free PMC article. - Structural determinants for ERK5 (MAPK7) and leucine rich repeat kinase 2 activities of benzo[e]pyrimido-[5,4-b]diazepine-6(11H)-ones.
Deng X, Elkins JM, Zhang J, Yang Q, Erazo T, Gomez N, Choi HG, Wang J, Dzamko N, Lee JD, Sim T, Kim N, Alessi DR, Lizcano JM, Knapp S, Gray NS. Deng X, et al. Eur J Med Chem. 2013;70:758-67. doi: 10.1016/j.ejmech.2013.10.052. Epub 2013 Oct 29. Eur J Med Chem. 2013. PMID: 24239623 Free PMC article.
References
- Jones MH, et al. Chemical genetics reveals a role for Mps1 kinase in kinetochore attachment during mitosis. Curr Biol. 2005;15:160–165. - PubMed
- Musacchio A, Salmon ED. The spindle-assembly checkpoint in space and time. Nat Rev Mol Cell Biol. 2007;8:379–393. - PubMed
Publication types
MeSH terms
Substances
Grants and funding
- CAPMC/ CIHR/Canada
- R01 GM077238-04/GM/NIGMS NIH HHS/United States
- P41 GM079575-03/GM/NIGMS NIH HHS/United States
- P41 GM079575/GM/NIGMS NIH HHS/United States
- WT_/Wellcome Trust/United Kingdom
- R01 GM077238-03/GM/NIGMS NIH HHS/United States
- R01 GM077238/GM/NIGMS NIH HHS/United States
LinkOut - more resources
Full Text Sources
Other Literature Sources
Chemical Information
Molecular Biology Databases
Research Materials


