Validation of a mouse xenograft model system for gene expression analysis of human acute lymphoblastic leukaemia - PubMed (original) (raw)
Validation of a mouse xenograft model system for gene expression analysis of human acute lymphoblastic leukaemia
Amy L Samuels et al. BMC Genomics. 2010.
Abstract
Background: Pre-clinical models that effectively recapitulate human disease are critical for expanding our knowledge of cancer biology and drug resistance mechanisms. For haematological malignancies, the non-obese diabetic/severe combined immunodeficient (NOD/SCID) mouse is one of the most successful models to study paediatric acute lymphoblastic leukaemia (ALL). However, for this model to be effective for studying engraftment and therapy responses at the whole genome level, careful molecular characterisation is essential.
Results: Here, we sought to validate species-specific gene expression profiling in the high engraftment continuous ALL NOD/SCID xenograft. Using the human Affymetrix whole transcript platform we analysed transcriptional profiles from engrafted tissues without prior cell separation of mouse cells and found it to return highly reproducible profiles in xenografts from individual mice. The model was further tested with experimental mixtures of human and mouse cells, demonstrating that the presence of mouse cells does not significantly skew expression profiles when xenografts contain 90% or more human cells. In addition, we present a novel in silico and experimental masking approach to identify probes and transcript clusters susceptible to cross-species hybridisation.
Conclusions: We demonstrate species-specific transcriptional profiles can be obtained from xenografts when high levels of engraftment are achieved or with the application of transcript cluster masks. Importantly, this masking approach can be applied and adapted to other xenograft models where human tissue infiltration is lower. This model provides a powerful platform for identifying genes and pathways associated with ALL disease progression and response to therapy in vivo.
Figures
Figure 1
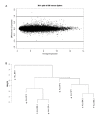
Comparison of differential expression levels between engrafted ALL-16 bone marrow (n = 4) and spleen (n = 4) xenografts. A MvA plot comparing expression differences with expression averages for all transcript clusters. Plots were generated using RMA normalised log2 signal intensities, lines represent 2-fold difference (log2 = 1). B Unsupervised hierarchical clustering of engrafted ALL-16 bone marrow (*) and spleen (+) xenografts from four NOD/SCID mice.
Figure 2
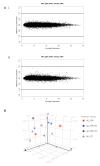
Assessment of differential expression after mixing ALL-16 xenografts with mouse cells (NES). A MvA plots comparing i ALL.100 (100% human ALL) (n = 8) with ALL.95 (95% human ALL) (n = 3) and ii ALL.100 with ALL.90 (90% human) (n = 6), MvA plot comparing expression differences with expression averages for all transcript clusters. Plots were generated using RMA normalised log2 signal intensities, lines represent 2-fold difference (log2 = 1). B Principle component analysis of global gene-expression profiles from ALL engrafted bone marrow, spleen tissues and cell mixtures of ALL.95 (95% human) and ALL.90 (90% human). Principle components were extracted using all transcript clusters. Four principle components were calculated, of which the first three are shown.
Figure 3
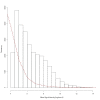
Histogram comparing mean signal intensity of engrafted ALL-16 xenografts and mouse non engrafted spleen (NES). Frequency and RMA normalised log2 mean signal intensity for all transcript clusters. The histogram compares ALL.100 (100% human ALL) (n = 8) represented by bars and mouse NES (n = 3) represented by a dashed line.
Figure 4
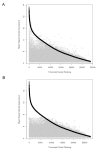
Comparison of ALL.100 ranked transcript cluster signal intensity to mouse non engrafted spleen (NES). Comparison of ranked ALL.100 (100% human ALL) (n = 8), shown in black, and corresponding mouse NES (n = 3), shown in grey, mean signal intensity. Transcript clusters are ranked according to descending mean signal intensity of ALL.100. A Without application of filter B Filtered, via the removal of mouse NES transcript clusters from the top 1% of normalised expression with a mean signal intensity > 7.56 (log base 2 scale).
Figure 5
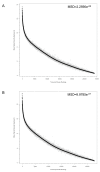
Comparison of ALL.100 ranked transcript cluster signal intensity to ALL.90. Comparison of ranked ALL.100 (100% human ALL) (n = 8) shown in black and corresponding ALL.90 (90% human) (n = 3), shown in grey, mean signal intensity. Transcript clusters are ranked according to descending mean signal intensity of ALL.100. A Without experimental mask B With application of experimental mask. Mean square distance (MSD) was measured between each ALL.100 transcript cluster and the corresponding ALL.90 transcript cluster.
Figure 6
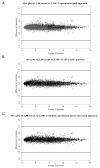
Application of in silico and experimental masks. MvA plots comparing expression differences with expression averages for all transcript clusters. Expression signals from ALL-16 xenografts ALL.100 (100% human) (n = 8) versus ALL.90 (90% human) (n = 3) were compared following the application of the A experimental B in silico or C combined masking approaches. Transcript clusters identified as susceptible to cross-species hybridisation are shown in black (.) all others are grey (.). Plots were generated using RMA normalised log2 signal intensities, lines represent 2-fold difference (log2 = 1).
Similar articles
- The nonobese diabetic/severe combined immunodeficient (NOD/SCID) mouse model of childhood acute lymphoblastic leukemia reveals intrinsic differences in biologic characteristics at diagnosis and relapse.
Lock RB, Liem N, Farnsworth ML, Milross CG, Xue C, Tajbakhsh M, Haber M, Norris MD, Marshall GM, Rice AM. Lock RB, et al. Blood. 2002 Jun 1;99(11):4100-8. doi: 10.1182/blood.v99.11.4100. Blood. 2002. PMID: 12010813 - BCL-2 expression by leukaemic blasts in a SCID mouse model of biphenotypic leukaemia associated with the t(4;11)(q21;q23) translocation.
Pocock CF, Malone M, Booth M, Evans M, Morgan G, Greil J, Cotter FE. Pocock CF, et al. Br J Haematol. 1995 Aug;90(4):855-67. doi: 10.1111/j.1365-2141.1995.tb05207.x. Br J Haematol. 1995. PMID: 7669664 - Engraftment of human T-cell acute lymphoblastic leukemia in immunodeficient NOD/SCID mice which have been preconditioned by injection of human cord blood.
Dialynas DP, Shao L, Billman GF, Yu J. Dialynas DP, et al. Stem Cells. 2001;19(5):443-52. doi: 10.1634/stemcells.19-5-443. Stem Cells. 2001. PMID: 11553853 - Evaluation of the NOD/SCID xenograft model for glucocorticoid-regulated gene expression in childhood B-cell precursor acute lymphoblastic leukemia.
Bhadri VA, Cowley MJ, Kaplan W, Trahair TN, Lock RB. Bhadri VA, et al. BMC Genomics. 2011 Nov 17;12:565. doi: 10.1186/1471-2164-12-565. BMC Genomics. 2011. PMID: 22093874 Free PMC article. - Diversity of human leukemia xenograft mouse models: implications for disease biology.
Meyer LH, Debatin KM. Meyer LH, et al. Cancer Res. 2011 Dec 1;71(23):7141-4. doi: 10.1158/0008-5472.CAN-11-1732. Epub 2011 Nov 16. Cancer Res. 2011. PMID: 22088964 Review.
Cited by
- Drug discovery oncology in a mouse: concepts, models and limitations.
Long JE, Jankovic M, Maddalo D. Long JE, et al. Future Sci OA. 2021 Jun 23;7(8):FSO737. doi: 10.2144/fsoa-2021-0019. eCollection 2021 Sep. Future Sci OA. 2021. PMID: 34295539 Free PMC article. Review. - Combination of PI3K and MEK inhibitors yields durable remission in PDX models of PIK3CA-mutated metaplastic breast cancers.
Coussy F, El Botty R, Lavigne M, Gu C, Fuhrmann L, Briaux A, de Koning L, Dahmani A, Montaudon E, Morisset L, Huguet L, Sourd L, Painsec P, Chateau-Joubert S, Larcher T, Vacher S, Melaabi S, Salomon AV, Marangoni E, Bieche I. Coussy F, et al. J Hematol Oncol. 2020 Feb 22;13(1):13. doi: 10.1186/s13045-020-0846-y. J Hematol Oncol. 2020. PMID: 32087759 Free PMC article. - Response to mTOR and PI3K inhibitors in enzalutamide-resistant luminal androgen receptor triple-negative breast cancer patient-derived xenografts.
Coussy F, Lavigne M, de Koning L, Botty RE, Nemati F, Naguez A, Bataillon G, Ouine B, Dahmani A, Montaudon E, Painsec P, Chateau-Joubert S, Laetitia F, Larcher T, Vacher S, Chemlali W, Briaux A, Melaabi S, Salomon AV, Guinebretiere JM, Bieche I, Marangoni E. Coussy F, et al. Theranostics. 2020 Jan 1;10(4):1531-1543. doi: 10.7150/thno.36182. eCollection 2020. Theranostics. 2020. PMID: 32042320 Free PMC article. - Heterogeneity in mechanisms of emergent resistance in pediatric T-cell acute lymphoblastic leukemia.
Yadav BD, Samuels AL, Wells JE, Sutton R, Venn NC, Bendak K, Anderson D, Marshall GM, Cole CH, Beesley AH, Kees UR, Lock RB. Yadav BD, et al. Oncotarget. 2016 Sep 13;7(37):58728-42. doi: 10.18632/oncotarget.11233. Oncotarget. 2016. PMID: 27623214 Free PMC article. - Stability of gene expression and epigenetic profiles highlights the utility of patient-derived paediatric acute lymphoblastic leukaemia xenografts for investigating molecular mechanisms of drug resistance.
Wong NC, Bhadri VA, Maksimovic J, Parkinson-Bates M, Ng J, Craig JM, Saffery R, Lock RB. Wong NC, et al. BMC Genomics. 2014 Jun 1;15(1):416. doi: 10.1186/1471-2164-15-416. BMC Genomics. 2014. PMID: 24885906 Free PMC article.
References
- Macor P, Secco E, Zorzet S, Tripodo C, Celeghini C, Tedesco F. An Update on the Xenograft and Mouse Models Suitable for Investigating New Therapeutic Compounds for the Treatment of B-Cell Malignancies. Current Pharmaceutical Design. 2008;14(21):2023–2039. doi: 10.2174/138161208785294591. - DOI - PubMed
- Lock RB, Liem N, Farnsworth ML, Milross CG, Xue C, Tajbakhsh M, Haber M, Norris MD, Marshall GM, Rice AM. The nonobese diabetic/severe combined immunodeficient (NOD/SCID) mouse model of childhood acute lymphoblastic leukemia reveals intrinsic differences in biologic characteristics at diagnosis and relapse. Blood. 2002;99(11):4100–4108. doi: 10.1182/blood.V99.11.4100. - DOI - PubMed
Publication types
MeSH terms
LinkOut - more resources
Full Text Sources
