PAK4: a pluripotent kinase that regulates prostate cancer cell adhesion - PubMed (original) (raw)
. 2010 May 15;123(Pt 10):1663-73.
doi: 10.1242/jcs.055707. Epub 2010 Apr 20.
Affiliations
- PMID: 20406887
- PMCID: PMC2864712
- DOI: 10.1242/jcs.055707
PAK4: a pluripotent kinase that regulates prostate cancer cell adhesion
Claire M Wells et al. J Cell Sci. 2010.
Abstract
Hepatocyte growth factor (HGF) is associated with tumour progression and increases the invasiveness of prostate carcinoma cells. Migration and invasion require coordinated reorganisation of the actin cytoskeleton and regulation of cell-adhesion dynamics. Rho-family GTPases orchestrate both of these cellular processes. p21-activated kinase 4 (PAK4), a specific effector of the Rho GTPase Cdc42, is activated by HGF, and we have previously shown that activated PAK4 induces a loss of both actin stress fibres and focal adhesions. We now report that DU145 human prostate cancer cells with reduced levels of PAK4 expression are unable to successfully migrate in response to HGF, have prominent actin stress fibres, and an increase in the size and number of focal adhesions. Moreover, these cells have a concomitant reduction in cell-adhesion turnover rates. We find that PAK4 is localised at focal adhesions, is immunoprecipitated with paxillin and phosphorylates paxillin on serine 272. Furthermore, we demonstrate that PAK4 can regulate RhoA activity via GEF-H1. Our results suggest that PAK4 is a pluripotent kinase that can regulate both actin cytoskeletal rearrangement and focal-adhesion dynamics.
Figures
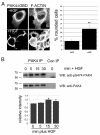
Fig. 1.
PAK4 is active in prostate cancer cells. (A) DU145 cells were maintained in low serum for 24 hours and then microinjected with PAK4ΔGBD-HA. Cells were then either maintained in low serum or stimulated with 10 ng/ml HGF for a further 16 hours. All cells were then fixed and stained for F-actin and the HA-tagged protein. HA-positive cells were imaged by confocal microscopy and scored for cell rounding. Over 30 cells were scored for each population in each of three separate experiments. **P<0.005 using Student's _t_-test. (B) DU145 cells were maintained in low serum for 24 hours and then stimulated with HGF (250 ng/ml) for the given times. Endogenous PAK4 was immunoprecipitated from cell lysates using a rabbit anti-PAK4 antibody and the western blot probed for PAK4-phosphoserine474. The blot was re-probed for total PAK4 using the IP antibody. Con IP, rabbit anti-HA IP (control). Autoradiographs were quantified and the relative intensity of phospho-PAK4 signal was normalised to total PAK4. The results shown are the means ± s.e.m. of three independent experiments. Statistical significance compared to time 0 was calculated using Student's _t_-test, *P<0.05. Scale bar: 10 μm.
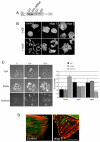
Fig. 2.
PAK4 knockdown in DU145 prostate cancer cells. (A) Untransfected (UT), control-siRNA-transfected (con) and _PAK4_-siRNA-transfected [oligo 1 (O1) and oligo 2 (O2)] DU145 cell lysates were blotted with antibody that recognises both PAK4 and PAK6. (B) Control-siRNA cells and _PAK4_-siRNA knockdown cells (oligo 1 and oligo 2) were starved in low serum for 24 hours. Cells were then either maintained in low serum or stimulated with HGF (10 ng/ml) for 24 hours. All cells were fixed and stained for F-actin. Confocal images were taken from the basal plane. (C) Control-siRNA cells and _PAK4_-siRNA knockdown cells (oligo 1 and oligo 2) were starved in low serum for 24 hours. Cells were then stimulated with HGF (10 ng/ml) and filmed for 16 hours. Still images are shown of a time series from a PAK4-knockdown film depicting an example of a colony that did not scatter (tight), a colony that had partially scattered (partial) and a colony from which clear cell-cell dissociation and independent cell migration could be observed (scattered). Movies of cell colonies from both control-siRNA- and _PAK4_-siRNA-treated cells were scored as either tight, partial or scattered as described above. Data was collated from more than 20 colonies for each condition over three separate experiments. (D) Control and PAK4-knockdown cells were serum starved for 24 hours, fixed and stained for F-actin (red) and paxillin (green). Scale bars: 20 μm (B); 10 μm (C,D).
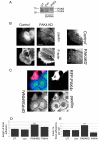
Fig. 3.
Reduced PAK4 expression leads to an increase in focal adhesions. (A) Cell lysates from control and PAK4 stable cell lines were blotted for PAK4 and PAK6 expression. (B) Control and _PAK4_-shRNAi-knockdown cells were maintained in low serum for 24 hours, fixed and stained for F-actin and paxillin. On the right (control' and PAK4KD') are higher-magnification images of the periphery of the cell. (C) GFP-positive PAK4 stable knockdown cells expressing an RFP-PAK4 rescue vector (PAK4r; see Materials and Methods) were maintained in low serum for 24 hours, fixed and stained for paxillin. (D) The mean length of focal adhesion per cell was calculated using ImageJ (NIH) software. >40 cells were analysed for each population over three separate experiments. The results shown are the means ± s.e.m. Statistical significance compared to control shRNA cells was calculated using Student's _t_-test; ***P<0.0005. (**E**) The number of focal adhesions per cell (counting only cells at the colony periphery) was calculated for all cell populations. >40 cells were analysed for each population over three separate experiments. The results shown are the means ± s.e.m. Statistical significance compared to wild-type cells was calculated using Student's _t_-test; ***P<0.0005. Scale bars: 10 μm.
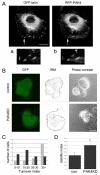
Fig. 4.
PAK4 affects focal-adhesion turnover. (A) DU145 cells were co-transfected with RFP-PAK4wt and GFP-talin, serum starved for 24 hours then fixed and imaged. Arrow indicates focal adhesions. (a,b) Higher-magnification image of the area indicated by the arrows. (B) Control and _PAK4_-shRNA-knockdown (PAK4KD) cells were serum starved for 24 hours then focal adhesions were imaged in real time using live cell confocal IRM. Still images of GFP expression, the composite IRM image and phase-contrast image from representative control and _PAK4_-shRNA-knockdown cells. (C) Analysis of turnover index and adhesion stability of control-shRNA (grey bars) and _PAK4_-knockdown-shRNA (black bars) cells. (D) Stability index of control-shRNA (con) and _PAK4_-knockdown-shRNA (PAK4KD) cells. The results shown are the means ± s.e.m. Statistical significance compared to control cells was calculated using Student's _t_-test; *P<0.05. In C and D, >15 cells were analysed for each population over three separate experiments (see Materials and Methods for details of analysis).
Fig. 5.
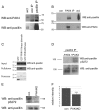
PAK4 phosphorylates paxillin at serine 272. (A) Endogenous paxillin was immunoprecipitated from DU145 cell lysates and probed for PAK4. Blots were re-probed for paxillin. wcl, whole cell lysate. Molecular mass (kDa) is shown to the right. (B) Endogenous PAK4 was immunoprecipitated from DU145 cell lysates and probed for paxillin. Blots were re-probed for PAK4. (C) GST alone, GST-PAK4 kinase domain and GST-PAK4Δkinase beads were used in an endogenous paxillin pulldown assay from cell lysates. Only GST-PAK4 kinase domain was able to pull down paxillin. (D) RFP-tagged paxillin was immunoprecipitated from HEK293 cell lysates, treated with calf intestinal phosphatase and incubated with or without recombinant active PAK4, then blotted for serine-272 phosphorylation. Serine-272 phosphorylation was only detected in the presence of recombinant PAK4. (E) Lysates from control (con) and PAK4-knockdown (PAK4KD) cell lines were probed for endogenous paxillin serine-272 phosphorylation and re-probed for total paxillin. (F) Autoradiographs were quantified and the relative intensity of phospho-serine-272-paxillin signal was normalised to total paxillin. The results shown are the means ± s.e.m. of three independent experiments. Statistical significance compared to control was calculated using Student's _t_-test; ***P<0.0005.
Fig. 6.
Adhesions in DU145 cells expressing a serine-272 phospho-mimic are reduced in size. DU145 cells expressing GFP-wt (wild-type), GFP-S272A and GFP-S272D paxillin (green) were fixed and stained for F-actin (red). Cells were imaged by confocal microscopy and the cell-spread area, elongation ratio and mean length of focal adhesion per cell was calculated using ImageJ (NIH) software. >30 cells were analysed for each population over three separate experiments. The results shown are the means ± s.e.m. Statistical significance compared to control shRNA cells was calculated using Student's _t_-test; *P<0.05. Scale bar: 10 μm.
Fig. 7.
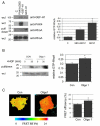
PAK4 regulates RhoA activity. (A) GST-Rhotekin RhoA pulldown assay from HEK293 cell lysates expressing GFP–GEF-H1 or co-expressing RFP-PAK4ΔGBD and GFP–GEF-H1. Whole-cell lysates (wcl) were probed for GEF-H1 expression, PAK4ΔGBD expression and total RhoA. C, untransfected cells. Autoradiographs of the level of active RhoA in all cells were quantified and the signal normalised to total RhoA. The results shown are the means ± s.e.m. of three independent experiments. Statistical significance compared to control was calculated using Student's _t_-test; *P<0.05. (B) GST-Rhotekin RhoA pulldown assay from DU145 control-siRNA and _PAK4_-siRNA knockdown (oligo 1) cell lysates in serum-starved and HGF-stimulated (30 minutes) conditions. Autoradiographs of the level of active RhoA-GTP in serum-starved cells were quantified and the signal normalised to total RhoA. The results shown are the means ± s.e.m. of three independent experiments. Statistical significance compared to control was calculated using Student's _t_-test; *P<0.05. (C) DU145 cells were transfected with a CFP/YFP FRET RhoA biosensor, incubated for 24 hours then transfected with control siRNA or PAK4 siRNA (oligo 1), incubated for a further 24 hours and then fixed and imaged using confocal microscopy (see Materials and Methods for details of FRET acquisition and analysis). Pseudocolour images of FRET efficiency in representative control and PAK4-knockdown cells are shown. The FRET-efficiency histogram represents the mean ± s.e.m. of three independent experiments. Statistical significance compared to control was calculated using Student's _t_-test; *P<0.05.
Fig. 8.
PAK4 regulates GEF-H1 phosphorylation. (A) Lysates from serum-starved control and _PAK4_-shRNA-knockdown DU145 cells were blotted for serine-885 GEF-H1 phosphorylation and re-probed for total GEF-H1. Autoradiographs of the level of phospho-serine-885-GEF-H1 in serum-starved cells were quantified using Andor IQ software (Andor UK) and the signal normalised to total GEF-H1. The results shown are the means ± s.e.m. of three independent experiments. Statistical significance compared to control was calculated using Student's _t_-test; *P<0.05. (B) Lysates from DU145 cells that had been maintained in low serum for 24 hours then stimulated by HGF (10 ng/ml) for the times indicated were probed for serine-885-GEF-H1 phosphorylation and re-probed for total GEF-H1. G, growing cells; S, serum-starved cells. Autoradiographs of the level of phospho-serine-885-GEF-H1 were quantified and the signal normalised to total GEF-H1 levels. The results shown are the means ± s.e.m. of three independent experiments. Statistical significance compared to time 0 was calculated using Student's _t_-test; *P<0.05.
Fig. 9.
PAK4 is activated in prostate cancer. Endogenous PAK4 was immunoprecipitated from a matched patient pair of normal prostate cells (NP) and prostate cancer (CT) cell lines derived from the same radical prostectomy and probed for serine-474 phosphorylation. Immunoprecipitates were re-probed for total PAK4. Autoradiographs of the level of phospho-PAK4 were quantified and the signal normalised to total PAK4 levels. The results shown are the means ± s.e.m. of three independent experiments. Statistical significance compared to normal was calculated using Student's _t_-test; *P<0.05.
Fig. 10.
PAK4 regulates adhesion and migration via multiple signalling pathways. RhoA is locally regulated during HGF-induced DU145 cell scattering with both activating (red lines) and inactivating (black lines) pathways. RhoA activation downstream of HGF might be the result of a direct or indirect interaction with the Met receptor (broken line), and is likely to be required for junctional disruption and cell contractility during migration. PAK4 mediates an inactivation pathway via GEF-H1. HGF-activated PAK4 phosphorylates GEF-H1 on serine 885; this phosphorylation inhibits exchange activity towards RhoA at localised areas within the cell. In parallel, active PAK4 phosphorylates paxillin on serine 272. Reduced levels of RhoA at the cell periphery and increased phosphorylation of paxillin at serine 272 drive the dissolution of actin stress fibres and focal adhesions required for HGF-induced cell scattering.
Similar articles
- A PAK4-LIMK1 pathway drives prostate cancer cell migration downstream of HGF.
Ahmed T, Shea K, Masters JR, Jones GE, Wells CM. Ahmed T, et al. Cell Signal. 2008 Jul;20(7):1320-8. doi: 10.1016/j.cellsig.2008.02.021. Epub 2008 Mar 12. Cell Signal. 2008. PMID: 18424072 - Guanine nucleotide exchange factor-H1 regulates cell migration via localized activation of RhoA at the leading edge.
Nalbant P, Chang YC, Birkenfeld J, Chang ZF, Bokoch GM. Nalbant P, et al. Mol Biol Cell. 2009 Sep;20(18):4070-82. doi: 10.1091/mbc.e09-01-0041. Epub 2009 Jul 22. Mol Biol Cell. 2009. PMID: 19625450 Free PMC article. - Paxillin-dependent paxillin kinase linker and p21-activated kinase localization to focal adhesions involves a multistep activation pathway.
Brown MC, West KA, Turner CE. Brown MC, et al. Mol Biol Cell. 2002 May;13(5):1550-65. doi: 10.1091/mbc.02-02-0015. Mol Biol Cell. 2002. PMID: 12006652 Free PMC article. - The guanine nucleotide exchange factor Tiam1: a Janus-faced molecule in cellular signaling.
Boissier P, Huynh-Do U. Boissier P, et al. Cell Signal. 2014 Mar;26(3):483-91. doi: 10.1016/j.cellsig.2013.11.034. Epub 2013 Dec 2. Cell Signal. 2014. PMID: 24308970 Review. - Regulation of phosphorylation pathways by p21 GTPases. The p21 Ras-related Rho subfamily and its role in phosphorylation signalling pathways.
Lim L, Manser E, Leung T, Hall C. Lim L, et al. Eur J Biochem. 1996 Dec 1;242(2):171-85. doi: 10.1111/j.1432-1033.1996.0171r.x. Eur J Biochem. 1996. PMID: 8973630 Review.
Cited by
- Trop-2 promotes prostate cancer metastasis by modulating β(1) integrin functions.
Trerotola M, Jernigan DL, Liu Q, Siddiqui J, Fatatis A, Languino LR. Trerotola M, et al. Cancer Res. 2013 May 15;73(10):3155-67. doi: 10.1158/0008-5472.CAN-12-3266. Epub 2013 Mar 27. Cancer Res. 2013. PMID: 23536555 Free PMC article. - In silico functional profiling of individual prostate cancer tumors: many genes, few functions.
Gorlov IP, Byun J, Logothetis CJ. Gorlov IP, et al. Cancer Genomics Proteomics. 2012 May-Jun;9(3):109-14. Cancer Genomics Proteomics. 2012. PMID: 22593245 Free PMC article. - Signaling, Regulation, and Specificity of the Type II p21-activated Kinases.
Ha BH, Morse EM, Turk BE, Boggon TJ. Ha BH, et al. J Biol Chem. 2015 May 22;290(21):12975-83. doi: 10.1074/jbc.R115.650416. Epub 2015 Apr 8. J Biol Chem. 2015. PMID: 25855792 Free PMC article. Review. - PAK4 inhibition improves PD-1 blockade immunotherapy.
Abril-Rodriguez G, Torrejon DY, Liu W, Zaretsky JM, Nowicki TS, Tsoi J, Puig-Saus C, Baselga-Carretero I, Medina E, Quist MJ, Garcia AJ, Senapedis W, Baloglu E, Kalbasi A, Cheung-Lau G, Berent-Maoz B, Comin-Anduix B, Hu-Lieskovan S, Wang CY, Grasso CS, Ribas A. Abril-Rodriguez G, et al. Nat Cancer. 2020;1(1):46-58. doi: 10.1038/s43018-019-0003-0. Epub 2019 Dec 9. Nat Cancer. 2020. PMID: 34368780 Free PMC article. - PAK4 suppresses TNF-induced release of endothelial microparticles in HUVECs cells.
Zhang S, Yin Y, Li C, Zhao Y, Wang Q, Zhang X. Zhang S, et al. Aging (Albany NY). 2020 Jul 12;12(13):12740-12749. doi: 10.18632/aging.103173. Epub 2020 Jul 12. Aging (Albany NY). 2020. PMID: 32657762 Free PMC article.
References
- Ahmed T., Shea K., Masters J. R. W., Jones G. E., Wells C. M. (2008). A PAK4-LIMK1 pathway drives prostate cancer cell migration downstream of HGF. Cell. Signal. 20, 1320-1328 - PubMed
- Arias-Romero L. E., Chernoff J. (2008). A tale of two Paks. Biol. Cell 100, 97-108 - PubMed
- Bailly M., Jones G. E. (2003). Polarised migration: cofilin holds the front. Curr. Biol. 13, R128-R130 - PubMed
- Barac A., Basile J., Vazquez-Prado J., Gao Y., Zheng Y., Gutkind J. S. (2004). Direct interaction of p21-activated kinase 4 with PDZ-RhoGEF, a G protein-linked Rho guanine exchange factor. J. Biol. Chem. 279, 6182-6189 - PubMed
Publication types
MeSH terms
Substances
LinkOut - more resources
Full Text Sources
Other Literature Sources
Medical
Molecular Biology Databases
Research Materials
Miscellaneous
