Counterregulation between the FcepsilonRI pathway and antiviral responses in human plasmacytoid dendritic cells - PubMed (original) (raw)
Counterregulation between the FcepsilonRI pathway and antiviral responses in human plasmacytoid dendritic cells
Michelle A Gill et al. J Immunol. 2010.
Abstract
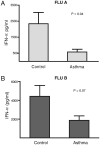
Plasmacytoid dendritic cells (pDCs) play essential roles in directing immune responses. These cells may be particularly important in determining the nature of immune responses to viral infections in patients with allergic asthma as well those with other atopic diseases. The purposes of this study were 1) to compare the functional capacity of pDCs in patients with one type of allergic disorder, allergic asthma, and controls; 2) to determine whether IgE cross-linking affects antiviral responses of influenza-exposed pDCs; and 3) to determine whether evidence of counterregulation of FcepsilonRIalpha and IFN-alpha pathways exists in these cells. pDC function was assessed in a subset of asthma patients and in controls by measuring IFN-alpha production after exposure of purified pDCs to influenza viruses. FcepsilonRIalpha expression on pDCs was determined by flow cytometry in blood samples from patients with allergic asthma and controls. pDCs from patients with asthma secreted significantly less IFN-alpha upon exposure to influenza A (572 versus 2815; p = 0.03), and secretion was inversely correlated with serum IgE levels. Moreover, IgE cross-linking prior to viral challenge resulted in 1) abrogation of the influenza-induced pDC IFN-alpha response; 2) diminished influenza and gardiquimod-induced TLR-7 upregulation in pDCs; and 3) interruption of influenza-induced upregulation of pDC maturation/costimulatory molecules. In addition, exposure to influenza and gardiquimod resulted in upregulation of TLR-7, with concomitant downregulation of FcepsilonRIalpha expression in pDCs. These data suggest that counterregulation of FcepsilonRI and TLR-7 pathways exists in pDCs, and that IgE cross-linking impairs pDC antiviral responses.
Figures
Figure 1
Purified pDCs from patients with allergic asthma secrete less IFN-α upon exposure to influenza viruses. Blood pDCs were isolated from patients with allergic asthma (n = 8) and controls (n = 9) and exposed to influenza A or B for 36 h. Mean (± SEM) IFN-α concentrations measured in culture supernatants are displayed in A (influenza A) and B (influenza B). Results of unpaired t tests are displayed.
Figure 2
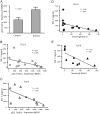
pDCs from patients with allergic asthma express increased surface FcεRIα, and this correlates inversely with influenza-induced IFN-α secretion. A, FcεRIα expression on pDCs was determined by flow cytometry (expressed as MESF) in the allergic asthma patient group and healthy control subjects. Results of t tests are displayed. Correlation between influenza A- and B-induced IFN-α release and pDC FcεRIα expression was determined (B and C, respectively). Significant inverse correlations are demonstrated for both influenza A- and influenza B-induced IFN-a secretion and pDC FcεRIα expression. Results of Pearson correlation tests are shown. Correlation between influenza A- and B-induced IFN-α release and serum IgE concentration was determined (D and E, respectively). Significant inverse correlations are demonstrated for both influenza A- and influenza B-induced IFN-α secretion and pDC FcεRIα expression. Results of Pearson correlation tests are shown.
Figure 3
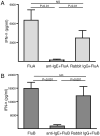
IgE cross-linking inhibits influenza-induced secretion of IFN-α in pDCs. Purified pDCs were cultured for 18 h with influenza A or influenza B, either alone or after preincubation with anti-IgE or rabbit IgG (as a control Ab), and IFN-α was measured in the supernatants. Data are expressed as mean ± SEM. ANOVA, p < 0.001 for A and B; results of Mann–Whitney t tests are displayed.
Figure 4
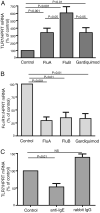
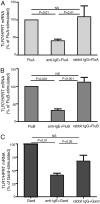
Exposure to influenza viruses and gardiquimod (a TLR-7 agonist) upregulates TLR-7 expression and downregulates FcεRIα expression in pDCs. A and B, Purified pDCs were cultured for 8 h with control media, influenza A, influenza B, or gardiquimod. Cells were harvested for RNA extraction and subsequent quantification of TLR-7 (A) or FcεR1α (B) mRNA by real-time RT-PCR, using hypoxanthine-guanine phosphoribosyltransferase as an endogenous control. Data are expressed as the mean ± SEM percentages of control pDC 2−ΔΔct values. Results represent five individual experiments. ANOVA, p < 0.01 for A and B. The p values displayed represent paired t test results. C, Purified pDCs were cultured with anti-IgE (5 μg/ml) or rabbit IgG (5 μg/ml) for 8 h and harvested for RNA extraction. TLR-7 mRNA was quantified as above. Data are expressed as the mean ± SEM percentages of control pDC 2−ΔΔct values of three individual experiments. ANOVA, p < 0.01; displayed p values represent results of unpaired t tests.
Figure 5
IgE cross-linking interferes with influenza- and gardiquimod-induced expression of TLR-7 in pDCs. A_–_C, Purified pDCs were cultured for 8 h with influenza A (A), influenza B (B), or gardiquimod (C), either alone or after preincubation with anti-IgE (5 μg/ml) or rabbit IgG (5 μg/ml). Cells were harvested for RNA extraction, generation of cDNA, and quantification of TLR-7 mRNA by RT-PCR. Hypoxanthine-guanine phosphoribosyltransferase was used as an endogenous control. Data are expressed as the mean ± SEM percentages of (A) influenza A-, (B) influenza B-, or (C) gardiquimod-stimulated pDC 2−ΔΔct values. Results represent seven individual experiments. ANOVA, p < 0.01 for A_–_C. Displayed p values represent Mann–Whitney t test results.
Figure 6
IgE cross-linking interferes with influenza-induced maturation of pDCs. A_–_C, Purified pDCs were cultured for 48 h with IL-3 alone (control), anti-IgE (5 μg/ml), rabbit IgG (5 μg/ml), or influenza A virus alone or after preincubation with anti-IgE or rabbit IgG. Cells were harvested, stained with CD86 PE-Cy5, CD80 FITC, and HLA-DR APC-Cy7 Abs, and the MFI of CD86 (A), CD80 (B), and HLA-DR (C) was measured by flow cytometry. Data are expressed as the mean ± SEM MFI values for displayed markers. Results of three individual experiments are displayed. Displayed p values represent results of paired t tests. Similar results for influenza B experiments are displayed in D_–_F. Data are expressed as the mean ± SEM.
Similar articles
- Innate immune responses to rhinovirus are reduced by the high-affinity IgE receptor in allergic asthmatic children.
Durrani SR, Montville DJ, Pratt AS, Sahu S, DeVries MK, Rajamanickam V, Gangnon RE, Gill MA, Gern JE, Lemanske RF Jr, Jackson DJ. Durrani SR, et al. J Allergy Clin Immunol. 2012 Aug;130(2):489-95. doi: 10.1016/j.jaci.2012.05.023. Epub 2012 Jul 4. J Allergy Clin Immunol. 2012. PMID: 22766097 Free PMC article. - Enhanced plasmacytoid dendritic cell antiviral responses after omalizumab.
Gill MA, Liu AH, Calatroni A, Krouse RZ, Shao B, Schiltz A, Gern JE, Togias A, Busse WW. Gill MA, et al. J Allergy Clin Immunol. 2018 May;141(5):1735-1743.e9. doi: 10.1016/j.jaci.2017.07.035. Epub 2017 Sep 1. J Allergy Clin Immunol. 2018. PMID: 28870461 Free PMC article. Clinical Trial. - IgE Inhibits Toll-like Receptor 7- and Toll-like Receptor 9-Mediated Expression of Interferon-α by Plasmacytoid Dendritic Cells in Patients With Systemic Lupus Erythematosus.
Khoryati L, Augusto JF, Shipley E, Contin-Bordes C, Douchet I, Mitrovic S, Truchetet ME, Lazaro E, Duffau P, Couzi L, Jacquemin C, Barnetche T, Vacher P, Schaeverbeke T, Blanco P, Richez C; Fédération Hospitalo-Universitaire ACRONIM. Khoryati L, et al. Arthritis Rheumatol. 2016 Sep;68(9):2221-31. doi: 10.1002/art.39679. Arthritis Rheumatol. 2016. PMID: 26991804 - Infection and cancer suppress pDC derived IFN-I.
Greene TT, Jo YR, Zuniga EI. Greene TT, et al. Curr Opin Immunol. 2020 Oct;66:114-122. doi: 10.1016/j.coi.2020.08.001. Epub 2020 Sep 15. Curr Opin Immunol. 2020. PMID: 32947131 Free PMC article. Review. - Interferon at the crossroads of allergy and viral infections.
Gonzales-van Horn SR, Farrar JD. Gonzales-van Horn SR, et al. J Leukoc Biol. 2015 Aug;98(2):185-94. doi: 10.1189/jlb.3RU0315-099R. Epub 2015 May 29. J Leukoc Biol. 2015. PMID: 26026068 Free PMC article. Review.
Cited by
- The role of DC subgroups in the pathogenesis of asthma.
Xu J, Cao S, Xu Y, Chen H, Nian S, Li L, Liu Q, Xu W, Ye Y, Yuan Q. Xu J, et al. Front Immunol. 2024 Oct 28;15:1481989. doi: 10.3389/fimmu.2024.1481989. eCollection 2024. Front Immunol. 2024. PMID: 39530090 Free PMC article. Review. - Potential Protective Factors for Allergic Rhinitis Patients Infected with COVID-19.
Dong J, Su D, Zhao B, Han J, Tu M, Zhang K, Wang F, An Y. Dong J, et al. Curr Issues Mol Biol. 2024 Jun 28;46(7):6633-6645. doi: 10.3390/cimb46070395. Curr Issues Mol Biol. 2024. PMID: 39057037 Free PMC article. Review. - The Possible Roles of IL-4/IL-13 in the Development of Eosinophil-Predominant Severe Asthma.
Nakagome K, Nagata M. Nakagome K, et al. Biomolecules. 2024 May 2;14(5):546. doi: 10.3390/biom14050546. Biomolecules. 2024. PMID: 38785953 Free PMC article. Review. - Altered COVID-19 immunity in children with asthma by atopic status.
Tong S, Scott JC, Eyoh E, Werthmann DW, Stone AE, Murrell AE, Sabino-Santos G, Trinh IV, Chandra S, Elliott DH, Smira AR, Velazquez JV, Schieffelin J, Ning B, Hu T, Kolls JK, Landry SJ, Zwezdaryk KJ, Robinson JE, Gunn BM, Rabito FA, Norton EB. Tong S, et al. J Allergy Clin Immunol Glob. 2024 Feb 29;3(2):100236. doi: 10.1016/j.jacig.2024.100236. eCollection 2024 May. J Allergy Clin Immunol Glob. 2024. PMID: 38590754 Free PMC article. - Identification of common genes of rhinovirus single/double‑stranded RNA‑induced asthma deterioration by bioinformatics analysis.
An Q, Cao Y, Guo W, Jiang Z, Luo H, Liu H, Zhan X. An Q, et al. Exp Ther Med. 2024 Mar 20;27(5):210. doi: 10.3892/etm.2024.12498. eCollection 2024 May. Exp Ther Med. 2024. PMID: 38590566 Free PMC article.
References
- Busse WW, Rosenwasser LJ. Mechanisms of asthma. J Allergy Clin Immunol. 2003;111:S799–804. - PubMed
- Gern JE. Mechanisms of virus-induced asthma. J Pediatr. 2003;142:S9–13. discussion S13–14. - PubMed
- Gehlhar K, Bilitewski C, Reinitz-Rademacher K, Rohde G, Bufe A. Impaired virus-induced interferon-alpha2 release in adult asthmatic patients. Clin Exp Allergy. 2006;36:331–337. - PubMed
- Bufe A, Gehlhar K, Grage-Griebenow E, Ernst M. Atopic phenotype in children is associated with decreased virus-induced interferon-alpha release. Int Arch Allergy Immunol. 2002;127:82–88. - PubMed
Publication types
MeSH terms
Substances
LinkOut - more resources
Full Text Sources
Other Literature Sources
