Nucleosome-depleted regions in cell-cycle-regulated promoters ensure reliable gene expression in every cell cycle - PubMed (original) (raw)
Nucleosome-depleted regions in cell-cycle-regulated promoters ensure reliable gene expression in every cell cycle
Lu Bai et al. Dev Cell. 2010.
Abstract
Many promoters in eukaryotes have nucleosome-depleted regions (NDRs) containing transcription factor binding sites. However, the functional significance of NDRs is not well understood. Here, we examine NDR function in two cell cycle-regulated promoters, CLN2pr and HOpr, by varying nucleosomal coverage of the binding sites of their activator, Swi4/Swi6 cell-cycle box (SCB)-binding factor (SBF), and probing the corresponding transcriptional activity in individual cells with time-lapse microscopy. Nucleosome-embedded SCBs do not significantly alter peak expression levels. Instead, they induce bimodal, "on/off" activation in individual cell cycles, which displays short-term memory, or epigenetic inheritance, from the mother cycle. In striking contrast, the same SCBs localized in NDR lead to highly reliable activation, once in every cell cycle. We further demonstrate that the high variability in Cln2p expression induced by the nucleosomal SCBs reduces cell fitness. Therefore, we propose that the NDR function in limiting stochasticity in gene expression promotes the ubiquity and conservation of promoter NDR. PAPERCLIP:
Copyright 2010 Elsevier Inc. All rights reserved.
Figures
Figure 1
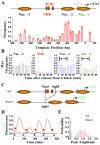
Nucleosome distribution and expression profile of wt _CLN2_pr. A) Genomic structure and nucleosome distribution on wt CLN2pr in asynchronized cells. The plot showed the measured nucleosome occupancy at different positions on the wt CLN2pr with the inferred locations of nucleosomes –1, –2 and –3 (shaded ovals) and NDR. The position 0 in the x axis is the CLN2pr TSS (chr16, 66788; Cross et al., 1994). The position of SCBs (red rectangles), TATA box (yellow rectangle) and TSS (arrow) were also shown. The error bars are the s.t.e from three independent measurements (same for below). B) The maximum occupancy of Nuc –3, NDR, Nuc –2 and Nuc –1 (left to right panels) in synchronized cells at different cell cycle time points after release from α factor block. The CLN2pr activation occurred within the marked time period (10–50 min after the release, including both mother and daughter cells; Figure S1B). C) The construct and the nucleosome distribution of 0mer promoter, where the NruI-SphI segment containing the SCBs were deleted. D) Typical GFP intensity vs time traces in a single cell driven by wt (red) or 0mer promoter (grey). The fluorescence signal was averaged over the cell area, corrected by subtracting a baseline connecting flanking troughs, and normalized by the average peak intensity per cell cycle of wt CLN2pr (same for the other figures unless specified). The colored arrows defined the cell division time marked by disappearance of Myo1 ring. E) The histogram of the peak-to-trough difference in the GFP signal per cell cycle for wt and 0mer promoters.
Figure 2
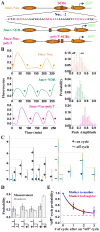
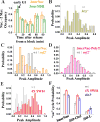
Construct, nucleosome distribution and expression profile of 3merNuc, 3merNDR and 3merNuc-polyT promoters. A) The construct of the three promoters. The sequence of the SCB-containing region in these promoters was shown with the SCB consensus highlighted in red. The polyT sequence was shown in magenta. The inferred nucleosome distributions on these promoters were also shown (see Figure S2B for nucleosome occupancy data). B) The expression profile of GFP driven by 3merNuc, 3merNDR and 3merNuc-polyT promoters. Left panel showed a typical single-cell GFP intensity vs time trace driven by each promoter with the arrows representing the cell division time. Right panel was the corresponding histogram of the peak-to-trough difference in the GFP signal per cell cycle. C) One example of the 3merNuc cell pedigree with mapped “on” (+) and “off” (−) cycles. D) The measured fractions of different transcription profiles following an “off” mother cycle, and comparison with random probabilities. E) Propagation of the “off” cycle between different cell generations for 3merNuc promoter, i.e. given one “off” cycle, the probability of the “off” cycle in the subsequent cell cycles in both mother and daughter. The horizontal line represented the “baseline” of average “off” cycle probability.
Figure 3
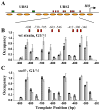
Genomic structure and nucleosome distribution on wt HOpr. A) Genomic structure of the wt HOpr. The locations of URS1, URS2, Swi5 binding sites (green rectangle), SCBs (red rectangles) and TSS (arrow) were shown in the diagram. We measured nucleosome distribution over a ~600 bp segment in URS2 (Figure 3B), and the rest was obtained from global nucleosome positioning data (Lee et al., 2007). B) Nucleosome distribution on the wt HOpr in wt strain synchronized in G1 (black) and M (grey) phases. The x axis represents the HOpr position relative to its TSS (chr4, 48081; Nagalakshmi et al., 2008). There was significant decrease in nucleosome occupancy in G1 phase. The exact locations of the SCB binding sites (relative to the TSS) were also shown in the plot. C) Nucleosome distribution on the wt HOpr in _swi5_− strain synchronized in G1 (black) and M (grey) phases. There was no significant difference in nucleosome occupancy in the two cell cycle points.
Figure 4
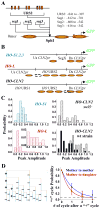
Construct and expression profile of HOpr variants. A) The construct of HO-S1,2,3 and HO-L promoters. These promoters were constructed by inserting HO URS2 (or part of it) into the SphI site in the 0mer promoter, and integrated into the CLN2 locus. The range of the HOpr inserts was shown on the side (relative to the HO TSS). B) The composition and nucleosome distribution on the HO-S1,2,3, HO-L and HO-CLN2 promoters (see Figure S3A for nucleosome occupancy data). Us: upstream; Ds: downstream. The short vertical bars represented SphI sites, and the arrows were the TSS. C) The expression profile of GFP driven by HO-S1, HO-L (left panels) and _HO_-CLN2pr in wt and _swi5_− strain background (right panels). The inset in the HO-L panel zoomed in the histogram of HO-L expression with high level. Note this long “tail” did not exist in the histogram of 0mer promoter expression (Figure 1E). _HO_-CLN2pr also shows “on/off” expression in wt daughter cells and both mother/daughter cells in _swi5_− strain (see text for details). D) One example of the HO-L cell pedigree with mapped “on” (+) and “off” (−) cycles (left panel). The right panel shows the propagation of the “on” cycle between different cell generations for HO-L promoter from mother to mother (blue) and mother to daughter (red). The analysis is identical as in Figure 2E.
Figure 5
Mechanism of “on/off” activation. A) Nucleosome –2 occupancy as a function of time in synchronized cell population on both 3merNuc and 3merNDR promoters. Note that at time 0 (before SBF activation), nucleosome –2 had ~100% occupancy in both promoters. B) The expression profile of 3merNuc promoter in wt (gray) vs _htz1_− strain (dark yellow). The two profiles are essentially identical. C,D) The expression profile for the 3merNuc (C) and 3merNuc-PolyT (D) promoters in the CY337 (wt)/CY407 (_snf2_–) background. 3merNuc promoter still activates in an “on/off” fashion in the absence of SWI/SNF, but the probability of “on” cycle decreases. In contrast, the expression of 3merNuc-PolyT promoter is not significantly affected. E) The expression profile of 3merNuc promoter in wt (1X SWI4) (gray) vs 4X SWI4 strain (red). Note the increase of the “on” cycle probability in the 4X SWI4 strain. F) The “on” cycle probability for 3merNuc, HO-CLN2 and _HO_-L promoters in the wt, 4X SWI4 and _sin3_− strains.
Figure 6
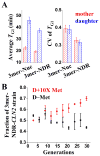
Biological consequence induced by 3merNuc-CLN2 vs 3merNDR-CLN2. A) The average _T_G1 (time from cell division to budding) and its coefficient of variation (CV) for both mother (red) and daughter cells (blue) in _cln1_− strains with either 3merNuc and 3merNDR promoters driving _CLN_2 expression. B) The fraction of 3merNDR-CLN2 strain in a growth competition assay with 3merNuc-CLN2 strain. 3merNDR-CLN2 strain gradually out competed 3merNuc-CLN2 strain in D+10X Met media (red), but not in D-Met where _Met3pr_-CLN2 was expressed.
Comment in
- First time, every time: nucleosomes at a promoter can determine the probability of gene activation.
Voth WP, Stillman DJ. Voth WP, et al. Dev Cell. 2010 Apr 20;18(4):503-4. doi: 10.1016/j.devcel.2010.04.006. Dev Cell. 2010. PMID: 20412763
Similar articles
- Nucleosomes Are Essential for Proper Regulation of a Multigated Promoter in Saccharomyces cerevisiae.
Yarrington RM, Goodrum JM, Stillman DJ. Yarrington RM, et al. Genetics. 2016 Feb;202(2):551-63. doi: 10.1534/genetics.115.183715. Epub 2015 Dec 1. Genetics. 2016. PMID: 26627840 Free PMC article. - Multiple sequence-specific factors generate the nucleosome-depleted region on CLN2 promoter.
Bai L, Ondracka A, Cross FR. Bai L, et al. Mol Cell. 2011 May 20;42(4):465-76. doi: 10.1016/j.molcel.2011.03.028. Mol Cell. 2011. PMID: 21596311 Free PMC article. - Role of Swi4 in cell cycle regulation of CLN2 expression.
Cross FR, Hoek M, McKinney JD, Tinkelenberg AH. Cross FR, et al. Mol Cell Biol. 1994 Jul;14(7):4779-87. doi: 10.1128/mcb.14.7.4779-4787.1994. Mol Cell Biol. 1994. PMID: 8007977 Free PMC article. - Transcription factors vs nucleosomes: regulation of the PHO5 promoter in yeast.
Svaren J, Hörz W. Svaren J, et al. Trends Biochem Sci. 1997 Mar;22(3):93-7. doi: 10.1016/s0968-0004(97)01001-3. Trends Biochem Sci. 1997. PMID: 9066259 Review.
Cited by
- Transcription goes digital.
Lionnet T, Singer RH. Lionnet T, et al. EMBO Rep. 2012 Apr 2;13(4):313-21. doi: 10.1038/embor.2012.31. EMBO Rep. 2012. PMID: 22410830 Free PMC article. Review. - Existence, Transition, and Propagation of Intermediate Silencing States in Ribosomal DNA.
Zou F, Du M, Chen H, Bai L. Zou F, et al. Mol Cell Biol. 2019 Nov 12;39(23):e00146-19. doi: 10.1128/MCB.00146-19. Print 2019 Dec 1. Mol Cell Biol. 2019. PMID: 31527077 Free PMC article. - Origin and consequences of the relationship between protein mean and variance.
Vallania FL, Sherman M, Goodwin Z, Mogno I, Cohen BA, Mitra RD. Vallania FL, et al. PLoS One. 2014 Jul 25;9(7):e102202. doi: 10.1371/journal.pone.0102202. eCollection 2014. PLoS One. 2014. PMID: 25062021 Free PMC article. - Probing chromatin accessibility with small molecule DNA intercalation and nanopore sequencing.
Bai G, Dhillon N, Felton C, Meissner B, Saint-John B, Shelansky R, Meyerson E, Hrabeta-Robinson E, Hodjat B, Boeger H, Brooks AN. Bai G, et al. bioRxiv [Preprint]. 2024 Mar 22:2024.03.20.585815. doi: 10.1101/2024.03.20.585815. bioRxiv. 2024. PMID: 38562899 Free PMC article. Preprint. - Nucleosomes Are Essential for Proper Regulation of a Multigated Promoter in Saccharomyces cerevisiae.
Yarrington RM, Goodrum JM, Stillman DJ. Yarrington RM, et al. Genetics. 2016 Feb;202(2):551-63. doi: 10.1534/genetics.115.183715. Epub 2015 Dec 1. Genetics. 2016. PMID: 26627840 Free PMC article.
References
- Abbott DW, Ivanova VS, Wang X, Bonner WM, Ausio J. Characterization of the stability and folding of H2A.Z chromatin particles: implications for transcriptional activation. J Biol Chem. 2001;276:41945–41949. - PubMed
- Acar M, Becskei A, van Oudenaarden A. Enhancement of cellular memory by reducing stochastic transitions. Nature. 2005;435:228–232. - PubMed
- Adkins MW, Howar SR, Tyler JK. Chromatin disassembly mediated by the histone chaperone Asf1 is essential for transcriptional activation of the yeast PHO5 and PHO8 genes. Mol Cell. 2004;14:657–666. - PubMed
- Albert I, Mavrich TN, Tomsho LP, Qi J, Zanton SJ, Schuster SC, Pugh BF. Translational and rotational settings of H2A.Z nucleosomes across the Saccharomyces cerevisiae genome. Nature. 2007;446:572–576. - PubMed
Publication types
MeSH terms
Substances
LinkOut - more resources
Full Text Sources
Other Literature Sources
Molecular Biology Databases
