Mammalian microRNAs: experimental evaluation of novel and previously annotated genes - PubMed (original) (raw)
. 2010 May 15;24(10):992-1009.
doi: 10.1101/gad.1884710. Epub 2010 Apr 22.
Lori W Schoenfeld, J Graham Ruby, Vincent C Auyeung, Noah Spies, Daehyun Baek, Wendy K Johnston, Carsten Russ, Shujun Luo, Joshua E Babiarz, Robert Blelloch, Gary P Schroth, Chad Nusbaum, David P Bartel
Affiliations
- PMID: 20413612
- PMCID: PMC2867214
- DOI: 10.1101/gad.1884710
Mammalian microRNAs: experimental evaluation of novel and previously annotated genes
H Rosaria Chiang et al. Genes Dev. 2010.
Abstract
MicroRNAs (miRNAs) are small regulatory RNAs that derive from distinctive hairpin transcripts. To learn more about the miRNAs of mammals, we sequenced 60 million small RNAs from mouse brain, ovary, testes, embryonic stem cells, three embryonic stages, and whole newborns. Analysis of these sequences confirmed 398 annotated miRNA genes and identified 108 novel miRNA genes. More than 150 previously annotated miRNAs and hundreds of candidates failed to yield sequenced RNAs with miRNA-like features. Ectopically expressing these previously proposed miRNA hairpins also did not yield small RNAs, whereas ectopically expressing the confirmed and newly identified hairpins usually did yield small RNAs with the classical miRNA features, including dependence on the Drosha endonuclease for processing. These experiments, which suggest that previous estimates of conserved mammalian miRNAs were inflated, provide a substantially revised list of confidently identified murine miRNAs from which to infer the general features of mammalian miRNAs. Our analyses also revealed new aspects of miRNA biogenesis and modification, including tissue-specific strand preferences, sequential Dicer cleavage of a metazoan precursor miRNA (pre-miRNA), consequential 5' heterogeneity, newly identified instances of miRNA editing, and evidence for widespread pre-miRNA uridylation reminiscent of miRNA regulation by Lin28.
Figures
Figure 1.
Mouse miRNAs and candidates initially identified by high-throughput sequencing. (A) Overlap between previously annotated miRNA hairpins (miRBase version 14.0; green), miRNA candidates identified in the current study, and the subset of these candidates that met our criteria for classification as confidently identified canonical miRNAs (red). Additional considerations increased the number of confidently identified canonical miRNAs to 475. (B) Overlap between previously annotated mirtrons and shRNAs and the mirtrons and shRNAs supported by our study, colored as in A.
Figure 2.
Experimental evaluation of annotated miRNAs and previously proposed candidates. (A) Schematic of the expression vector transfected into HEK293T cells. (B) Examples of the standard ectopic expression assay, transfecting plasmids indicated in the key. Reads from the control transfection (no hairpin plasmid) were from endogenous expression in HEK293T cells. (C) Assay results for annotated human miRNAs and published candidates. Bars are colored as in B; asterisks indicate detectable overexpression (≥1 read from both the anticipated miRNA and miRNA*, with miRNA and miRNA* combined expressed more than threefold over endogenous levels). (D) Assay results for unconfirmed annotated mouse miRNAs and published candidates. Mouse controls were selected from miRNAs that were sequenced from our mouse samples. Bars are colored as in B; detectable overexpression is indicated (asterisks). Shown are the results compiled from two experiments (Supplemental Figs. S3, S4).
Figure 3.
Experimental evaluation of novel miRNAs and candidates. (A) Examples of assays evaluating Drosha dependence, transfecting plasmids indicated in the key. (B) Assay results for control miRNAs, novel miRNAs, and miRNA candidates. Bars are colored as in A; detectable overexpression (black asterisks), overexpression attempted but not detected (black minus sign), detectable Drosha dependence (orange asterisks), and Drosha dependence assayed but not detected (orange minus sign) are all indicated. Shown are the results compiled from three experiments (Supplemental Figs. S5–S7).
Figure 4.
miRNA relative expression profiles. Profiles of mature miRNAs were constructed as described (Ruby et al. 2007b). The relative contribution of each miRNA from each sample and the sum of the normalized reads of all samples are provided (Supplemental Table 5).
Figure 5.
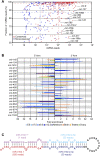
Reads from both arms of a hairpin, and sequential reads from the same arm. (A) Fraction and abundance of miRNA reads from each miRNA hairpin. To calculate the fraction, the miRNA reads were divided by the total number of miRNA and miRNA* reads, considering on each arm only the major 5′ terminus. The dashed lines indicate the median fraction of miRNA reads and the median number of miRNA reads for conserved (red) and nonconserved (blue) miRNAs. (B) Switching of the dominant arm in different samples. For each sample, the fold enrichment of miRNA reads produced from the 5′ arm over those produced from the 3′ arm and vice versa was calculated. Shown are results for nonrepetitive miRNAs that switch dominant arms, with at least a fivefold differential between two samples. The samples are color-coded (key), and an asterisk indicates samples with statistically significant enrichment of miRNAs produced from one arm over the other (P < 0.05, χ2 test). (C) Sequential Dicer cleavage. Predicted secondary structure of mmu-mir-3102 pre-miRNA (Hofacker et al. 1994).
Figure 6.
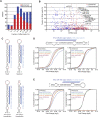
miRNAs with 5′ heterogeneity. (A) The distribution of conserved (red) and nonconserved (blue) miRNAs with reads ≤5 nt offset at their 5′ terminus. (B) The fraction of offset reads and abundance of reads for each miRNA hairpin, colored as in A. The dashed lines indicate the median level of reads for conserved (red) and nonconserved (blue) miRNAs. (C) 5′ Heterogeneity of miR-133a. Data from mouse heart (Rao et al. 2009) and newborn are mapped to the mir-133a-1 hairpin (top), and data from the ectopic expression assay are mapped to the indicated transfected hairpin (bottom). The lines indicate miR-133a.1 (dark blue) and miR-133a.2 (light blue), and red nucleotides indicate those that differ between mir-133a-1 and mir-133a-2. (D) Effect of losing miR-223 on messages with 3′ UTR sites for miR-223 major and minor isoforms. (Top) Small RNA sequencing data from mouse neutrophils (Baek et al. 2008) were mapped to the mir-223 hairpin as in C. For each set of messages with the indicated 3′ UTR site for miR-233 (major isoform sites, bottom left; minor isoform sites, bottom right), the fraction that changed at least to the degree indicated following loss of miR-223 is plotted, using data published for neutrophils differentiated in vivo (Baek et al. 2008). (E) Effect of losing miR-155 on messages with 3′ UTR sites for miR-155 major and minor isoforms, plotted as in D using published data from T cells (Rodriguez et al. 2007). (Top) Sequencing data from our study are mapped to the mir-155 hairpin as in C. The mRNAs with 8mer and 7mer-A1 sites for the minor isoform were excluded from the analysis because these sites overlapped with 7mer-m8 sites for the major isoform.
Figure 7.
Untemplated nucleotide addition. (A) Untemplated nucleotide addition rate for miRNA and miRNA* reads from the indicated arm. Rates for each miRNA are provided (Supplemental Table 6). As a control, tRNA degradation fragments were analyzed similarly. Numbers of genes analyzed are indicated in parentheses. (B) Distribution of rates for untemplated U addition to RNAs from the 5′ arm (blue) and from the 3′ arm (red). (C) Distribution of rates for untemplated A addition to RNAs from the 5′ arm (blue) and from the 3′ arm (red). (D) Schematic of the biogenesis stage in which U could be added to the RNA of only one arm (pre-miRNA, left), and the stage in which U could be added to the RNA of either arm (mature miRNA and miRNA*, right).
Similar articles
- Analysis of Nearly One Thousand Mammalian Mirtrons Reveals Novel Features of Dicer Substrates.
Wen J, Ladewig E, Shenker S, Mohammed J, Lai EC. Wen J, et al. PLoS Comput Biol. 2015 Sep 1;11(9):e1004441. doi: 10.1371/journal.pcbi.1004441. eCollection 2015 Sep. PLoS Comput Biol. 2015. PMID: 26325366 Free PMC article. - Genome-wide identification of targets of the drosha-pasha/DGCR8 complex.
Kadener S, Rodriguez J, Abruzzi KC, Khodor YL, Sugino K, Marr MT 2nd, Nelson S, Rosbash M. Kadener S, et al. RNA. 2009 Apr;15(4):537-45. doi: 10.1261/rna.1319309. Epub 2009 Feb 17. RNA. 2009. PMID: 19223442 Free PMC article. - Re-evaluation of the roles of DROSHA, Export in 5, and DICER in microRNA biogenesis.
Kim YK, Kim B, Kim VN. Kim YK, et al. Proc Natl Acad Sci U S A. 2016 Mar 29;113(13):E1881-9. doi: 10.1073/pnas.1602532113. Epub 2016 Mar 14. Proc Natl Acad Sci U S A. 2016. PMID: 26976605 Free PMC article. - MicroRNA biogenesis: isolation and characterization of the microprocessor complex.
Gregory RI, Chendrimada TP, Shiekhattar R. Gregory RI, et al. Methods Mol Biol. 2006;342:33-47. doi: 10.1385/1-59745-123-1:33. Methods Mol Biol. 2006. PMID: 16957365 Review. - Production of small RNAs by mammalian Dicer.
Svobodova E, Kubikova J, Svoboda P. Svobodova E, et al. Pflugers Arch. 2016 Jun;468(6):1089-102. doi: 10.1007/s00424-016-1817-6. Epub 2016 Apr 6. Pflugers Arch. 2016. PMID: 27048428 Free PMC article. Review.
Cited by
- MicroRNA and piRNA profiles in normal human testis detected by next generation sequencing.
Yang Q, Hua J, Wang L, Xu B, Zhang H, Ye N, Zhang Z, Yu D, Cooke HJ, Zhang Y, Shi Q. Yang Q, et al. PLoS One. 2013 Jun 24;8(6):e66809. doi: 10.1371/journal.pone.0066809. Print 2013. PLoS One. 2013. PMID: 23826142 Free PMC article. - Molecular basis for improved gene silencing by Dicer substrate interfering RNA compared with other siRNA variants.
Snead NM, Wu X, Li A, Cui Q, Sakurai K, Burnett JC, Rossi JJ. Snead NM, et al. Nucleic Acids Res. 2013 Jul;41(12):6209-21. doi: 10.1093/nar/gkt200. Epub 2013 Apr 24. Nucleic Acids Res. 2013. PMID: 23620279 Free PMC article. - MiRmat: mature microRNA sequence prediction.
He C, Li YX, Zhang G, Gu Z, Yang R, Li J, Lu ZJ, Zhou ZH, Zhang C, Wang J. He C, et al. PLoS One. 2012;7(12):e51673. doi: 10.1371/journal.pone.0051673. Epub 2012 Dec 27. PLoS One. 2012. PMID: 23300555 Free PMC article. - Substrate-specific structural rearrangements of human Dicer.
Taylor DW, Ma E, Shigematsu H, Cianfrocco MA, Noland CL, Nagayama K, Nogales E, Doudna JA, Wang HW. Taylor DW, et al. Nat Struct Mol Biol. 2013 Jun;20(6):662-70. doi: 10.1038/nsmb.2564. Epub 2013 Apr 28. Nat Struct Mol Biol. 2013. PMID: 23624860 Free PMC article. - Small RNA deep sequencing reveals a distinct miRNA signature released in exosomes from prion-infected neuronal cells.
Bellingham SA, Coleman BM, Hill AF. Bellingham SA, et al. Nucleic Acids Res. 2012 Nov;40(21):10937-49. doi: 10.1093/nar/gks832. Epub 2012 Sep 10. Nucleic Acids Res. 2012. PMID: 22965126 Free PMC article.
References
- Bartel DP 2004. MicroRNAs: Genomics, biogenesis, mechanism, and function. Cell 116: 281–297 - PubMed
Publication types
MeSH terms
Substances
Grants and funding
- R01 NS057221-01A1/NS/NINDS NIH HHS/United States
- T32 GM007753/GM/NIGMS NIH HHS/United States
- K08 NS048118-05/NS/NINDS NIH HHS/United States
- K08 NS048118-04/NS/NINDS NIH HHS/United States
- R01 NS057221-02/NS/NINDS NIH HHS/United States
- R01 GM067031/GM/NIGMS NIH HHS/United States
- K08 NS048118-02/NS/NINDS NIH HHS/United States
- GM067031/GM/NIGMS NIH HHS/United States
- K08 NS048118/NS/NINDS NIH HHS/United States
- HHMI/Howard Hughes Medical Institute/United States
- K08 NS048118-03/NS/NINDS NIH HHS/United States
- R01 NS057221/NS/NINDS NIH HHS/United States
- R01 NS057221-03/NS/NINDS NIH HHS/United States
LinkOut - more resources
Full Text Sources
Other Literature Sources
Medical
Molecular Biology Databases
Research Materials


