Physiological insights gained from gene expression analysis in obesity and diabetes - PubMed (original) (raw)
Review
Physiological insights gained from gene expression analysis in obesity and diabetes
Mark P Keller et al. Annu Rev Nutr. 2010.
Abstract
Microarray technology permits the interrogation of nearly all expressed genes under a wide range of conditions. Patterns of gene expression in response to obesity and diabetes have yielded important insights into the pathogenesis of diabetes and its relationship to obesity. In muscle, microarray studies have motivated research into mitochondrial function. In adipose tissue, clues have pointed to the importance of inflammation in obesity. New adipocyte-derived hormones involved in insulin resistance have been found; a notable example is retinol binding protein 4. In liver, genes responsive to master regulators of lipid metabolism have been identified. In beta-cells, genes involved in cell survival, cell proliferation, and insulin secretion have been identified. These studies have greatly expanded our understanding of mechanisms underlying the pathogenesis of obesity-induced diabetes. When combined with genetic information, microarray data can be used to construct causal network models linking gene expression with disease.
Figures
Figure 1
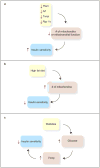
Experimental observations where mitochondrial function or number of mitochondria is negatively correlated with insulin sensitivity. (a) In four different knockout mouse models that affect mitochondrial function or number of mitochondria in skeletal muscle, there is a marked improvement in insulin sensitivity. (b) High-fat diets increase the number of skeletal muscle mitochondria. The effect on PGC1α is controversial. But, these diets are associated with reduced insulin sensitivity. (c) Hyperglycemia itself is associated with reduced muscle insulin sensitivity. A highly glucose-responsive gene, Txnip, when highly expressed, reduces insulin sensitivity and conversely, as illustrated in panel a, when knocked out in skeletal muscle, is associated with improved insulin sensitivity.
Figure 2
Obesity causes metabolic and endocrine changes in adipose tissue. Leptin acts in an autocrine fashion on adipocytes to promote lipogenesis and reduce uncoupled oxidative phosphorylation. Obesity promotes leptin resistance, thus reducing lipogenesis in adipose tissue and promoting it in other tissues, leading to accumulation of triglycerides in the liver (hepatic steatosis). In muscle, increased fatty acid flux leads to insulin resistance. In β-cells, fatty acids can promote lipotoxicity and impair β-cell function and survival. Adipocytes in obese individuals produced adipokines that promote insulin resistance (e.g., RBP4 and resistin). Obesity promotes an inflammatory response in adipose tissue wherein macrophages and lymphocytes are recruited to adipose tissue and promote inflammation and insulin resistance. The insulin resistance in adipocytes increases the rate of triglyceride lipolysis, increasing the flux of free fatty acids to other tissues.
Figure 3
Diabetes has detrimental effects on β-cells. In the early stages of type 2 diabetes, β-cells produce insulin at an elevated level in an attempt to compensate for insulin resistance. However, hyperglycemia compromises two key mechanisms by which β-cells mount a compensatory response to insulin resistance. First, glucose induces the expression of Txnip, a proapoptotic gene. Second, hyperglycemia downregulates the expression of the transcription factor Arnt. This leads to reduced glucose oxidation and reduced glucose sensing, resulting in reduced insulin secretion.
Figure 4
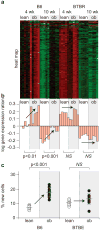
Coexpression modules enriched with cell cycle regulation accurately predict diabetes and obesity. (a) Expression heat maps and (b) the PC1 on log10 scale of the cell cycle regulatory modules in islets (217 transcripts) and adipose (96 transcripts) are shown. For the heat maps, red shows increased expression, green shows decreased expression, and black is neutral. Bar plots in (b) show the PC1 for individual mice and correspond to an decreased expression for negative values and increased expression for positive values. (c) The percentage of new cells, derived from an in vivo measure of 2H incorporation into newly synthesized DNA, is shown for islets and adipose tissue. Where significant obesity-dependent differences were observed, _P_-values are shown. Arrows are used to show influence of obesity. NS, not significant. Figure and legend reprinted from (71).
Figure 5
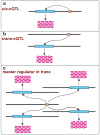
Cis- and _trans-_acting expression quantitative trait loci (eQTLs). (a) When mRNA abundance maps as a phenotype near the physical location of the gene encoding the mRNA, it is termed a _cis-_eQTL or a proximal eQTL. (b) When the mRNA abundance maps to a genomic location that is distinctly separate from the physical location of the gene encoding the mRNA (e.g., a different chromosome, as shown), it is described as a _trans_-eQTL or distal eQTL. (c) When multiple mRNA abundance phenotypes map to the same genomic location in trans, then one can hypothesize that there might be one or more regulators encoded at that location that coordinately regulate this set of mRNAs. This result is one step in building network models of gene regulation.
Similar articles
- Please pass the chips: genomic insights into obesity and diabetes.
Nadler ST, Attie AD. Nadler ST, et al. J Nutr. 2001 Aug;131(8):2078-81. doi: 10.1093/jn/131.8.2078. J Nutr. 2001. PMID: 11481397 Review. - [Identification of genes that are differentially expressed in omental fat of normal weight subjects, obese subjects and obese diabetic patients].
Luo TH, Zhao Y, Li G, Zhang HL, Li WY, Ldu M. Luo TH, et al. Zhongguo Ying Yong Sheng Li Xue Za Zhi. 2007 May;23(2):229-34. Zhongguo Ying Yong Sheng Li Xue Za Zhi. 2007. PMID: 21179778 Chinese. - Serum retinol binding protein 4 contributes to insulin resistance in obesity and type 2 diabetes.
Yang Q, Graham TE, Mody N, Preitner F, Peroni OD, Zabolotny JM, Kotani K, Quadro L, Kahn BB. Yang Q, et al. Nature. 2005 Jul 21;436(7049):356-62. doi: 10.1038/nature03711. Nature. 2005. PMID: 16034410 - Tissue distribution and quantification of the expression of mRNAs of peroxisome proliferator-activated receptors and liver X receptor-alpha in humans: no alteration in adipose tissue of obese and NIDDM patients.
Auboeuf D, Rieusset J, Fajas L, Vallier P, Frering V, Riou JP, Staels B, Auwerx J, Laville M, Vidal H. Auboeuf D, et al. Diabetes. 1997 Aug;46(8):1319-27. doi: 10.2337/diab.46.8.1319. Diabetes. 1997. PMID: 9231657 - Rewiring of Lipid Metabolism in Adipose Tissue Macrophages in Obesity: Impact on Insulin Resistance and Type 2 Diabetes.
Dahik VD, Frisdal E, Le Goff W. Dahik VD, et al. Int J Mol Sci. 2020 Jul 31;21(15):5505. doi: 10.3390/ijms21155505. Int J Mol Sci. 2020. PMID: 32752107 Free PMC article. Review.
Cited by
- ReDirection: an R-package to compute the probable dissociation constant for every reaction of a user-defined biochemical network.
Kundu S. Kundu S. Front Mol Biosci. 2023 Oct 24;10:1206502. doi: 10.3389/fmolb.2023.1206502. eCollection 2023. Front Mol Biosci. 2023. PMID: 37942290 Free PMC article. - Mitochondrial Methionyl-tRNA Formyltransferase Deficiency Alleviates Metaflammation by Modulating Mitochondrial Activity in Mice.
Sun X, Liu S, Cai J, Yang M, Li C, Tan M, He B. Sun X, et al. Int J Mol Sci. 2023 Mar 22;24(6):5999. doi: 10.3390/ijms24065999. Int J Mol Sci. 2023. PMID: 36983072 Free PMC article. - Mitochondrial Dynamics and Mitophagy in Cardiometabolic Disease.
Lin J, Duan J, Wang Q, Xu S, Zhou S, Yao K. Lin J, et al. Front Cardiovasc Med. 2022 Jun 17;9:917135. doi: 10.3389/fcvm.2022.917135. eCollection 2022. Front Cardiovasc Med. 2022. PMID: 35783853 Free PMC article. Review. - Mitophagy-mediated adipose inflammation contributes to type 2 diabetes with hepatic insulin resistance.
He F, Huang Y, Song Z, Zhou HJ, Zhang H, Perry RJ, Shulman GI, Min W. He F, et al. J Exp Med. 2021 Mar 1;218(3):e20201416. doi: 10.1084/jem.20201416. J Exp Med. 2021. PMID: 33315085 Free PMC article.
References
- Abel ED, Peroni O, Kim JK, Kim YB, Boss O, et al. Adipose-selective targeting of the GLUT4 gene impairs insulin action in muscle and liver. Nature. 2001;409:729–33. - PubMed
- Aeberli I, Biebinger R, Lehmann R, L'Allemand D, Spinas GA, Zimmermann MB. Serum retinolbinding protein 4 concentration and its ratio to serum retinol are associated with obesity and metabolic syndrome components in children. J Clin Endocrinol Metab. 2007;92:4359–65. - PubMed
- Aigner E, Bachofner N, Klein K, De Geyter C, Hohla F, et al. Retinol-binding protein 4 in polycystic ovary syndrome—association with steroid hormones and response to pioglitazone treatment. J Clin Endocrinol Metab. 2009;94:1229–35. - PubMed
Publication types
MeSH terms
LinkOut - more resources
Full Text Sources
Medical


