c-Myc regulates transcriptional pause release - PubMed (original) (raw)
c-Myc regulates transcriptional pause release
Peter B Rahl et al. Cell. 2010.
Abstract
Recruitment of the RNA polymerase II (Pol II) transcription initiation apparatus to promoters by specific DNA-binding transcription factors is well recognized as a key regulatory step in gene expression. We report here that promoter-proximal pausing is a general feature of transcription by Pol II in mammalian cells and thus an additional step where regulation of gene expression occurs. This suggests that some transcription factors recruit the transcription apparatus to promoters, whereas others effect promoter-proximal pause release. Indeed, we find that the transcription factor c-Myc, a key regulator of cellular proliferation, plays a major role in Pol II pause release rather than Pol II recruitment at its target genes. We discuss the implications of these results for the role of c-Myc amplification in human cancer.
2010 Elsevier Inc. All rights reserved.
Figures
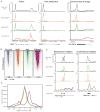
Figure 1. Genome-wide occupancy of Pol II
(A) Occupancy of RNA Pol II (all), RNA Pol II Ser5P and RNA Pol II Ser2P in mES cells, determined by ChIP-seq analysis. Enrichment at a representative active gene (Rpl3) and non-productive gene (Surb7) is shown. Genome-wide binding averages (introns not depicted), in 50bp bins, are shown for each Pol II form to display the general binding patterns along the transcription unit from 2kb upstream of the transcriptional start site to 2.5kb downstream of the end of each annotated gene. (B) Schematic representation describing the calculation used to determine the traveling ratio (TR) at each Pol II bound gene in mES cells. The promoter proximal bin is defined using a fixed window from −30bp to +300bp around the annotated start site. The transcribed region (gene body) bin is from +300bp to the annotated end. The TR is the ratio of Pol II density in the promoter proximal bin and the Pol II density in the transcribed region bin. (C) Distribution of the percent of Pol II bound genes with a given TR. Approximately 91% of genes have a TR greater than 2, indicating the majority of Pol II bound genes have more Pol II in the promoter proximal region compared to the downstream transcribed region. See also Figure S1.
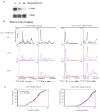
Figure 2. P-TEFb inhibition prevents release of promoter proximal Pol II
(A) mES cells were treated with 1μM flavopiridol for the indicated time. Extracts were analyzed by Western blot using antibodies against Pol II Ser2P, Spt5, Cdk9 and Brg1 (used as a loading control). ** indicates higher molecular weight Spt5 species, as reported in (Yamada et al., 2006), that is flavopiridol sensitive. * indicates lower molecular weight Spt5 species. See also Figure S2A. (B) RNA Pol II (all) ChIP-seq analysis in mES cells treated with control (DMSO for 60 minutes, black) or flavopiridol (1μM for 60 minutes, red). This panel shows the changes in Pol II occupancy at four example actively transcribed genes following flavopiridol treatment. See also Figure S2B. (C) Pol II traveling ratio distribution in flavopiridol-treated and control-treated mES cells for active genes (Pol II bound with H3K79me2-modified nucleosomes). Higher TR values indicate a higher degree of pausing. (D) Pol II traveling ratio distribution for non-productive genes in mES cells (Pol II bound but without H3K79me2-modified nucleosomes), demonstrating that the TR distribution remains relatively the same for non-productive genes whether treated with control or flavopiridol.
Figure 3. DSIF and NELF co-occupy most genes with Pol II
(A) Binding of Pol II (all), NelfA (NELF subunit), Spt5 (DSIF subunit) and Ctr9 (PAF1 subunit) using ChIP-seq analysis at a representative active gene (Rpl3), and non-productive gene (Surb7) in mES cells. Genome-wide binding averages (introns not depicted), in 50bp bins, are shown for each factor to display the general binding patterns along the transcription unit of RefSeq genes, from 2kb upstream of the transcriptional start site to 2.5kb downstream of the end of each annotated gene. (B) Heatmap representation of ChIP-seq binding for Pol II (all; grey), NelfA (orange), Spt5 (green) and H3K4me3 (purple) at all mouse RefSeq genes, rank ordered from most Pol II to lowest Pol II. Color means enrichment, white means no enrichment. See also Figure S3. (C) Spatial distribution of the distance of Spt5, NelfA and H3K4me3 peaks from the promoter proximal Pol II peak at each enriched Pol II gene, demonstrating a general overlaps with Spt5, NelfA and Pol II peaks. (D) ChIP-seq binding plots showing Pol II (all), Spt5 (DSIF), NelfA (NELF), elongation-associated chromatin modification (H3K79me2) and TSSa-RNA reads that map to this genomic region at a bidirectional intiated gene (Hsd17b12) and unidirectional initiated gene (Rpl6). Red arrows represent TSSa-RNA species that map in the antisense direction to the gene, and blue arrows represent TSSa-RNA species that map in the sense direction to the gene.
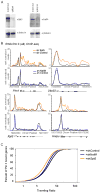
Figure 4. DSIF knockdown alters Pol II occupancy at many genes
(A) Spt5 (left) and NelfA (right) protein levels after the indicated shRNA-mediated knockdown in mES cells as determined by Western blot using Spt5 or NelfA antibodies. β-Tubulin protein is a loading control. (B) RNA Pol II (all) ChIP-seq binding density in shControl (black), shSpt5 (orange) and shNelfA (blue) mES cells analysis at five active genes in mES cells. (C) RNA Pol II TR calculations in shControl, shSpt5 and shNelfA mES cells, showing that many genes become less paused following Spt5 knockdown and a more subtle change following NelfA knockdown. Lower TR values indicate a lower degree of pausing. See also Figure S4.
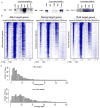
Figure 5. c-Myc target genes are enriched in actively transcribed genes and c-Myc/Max associates with P-TEFb in mES cells
(A) Co-immunoprecipitation experiments in mES cells using antibodies against IgG (to measure background binding), or endogenous c-Myc, Max, Cdk9, and CycT1. Proteins were immunopreipicated from mES cell lysates and analyzed by Western blot analysis by probing for Max, Cdk9 and CycT1. 10% input was loaded for the Max and Cdk9 blots, 1% input was loaded for the CycT1 blot. (B) Heatmap representation illustrating the transcriptional state of c-Myc, Oct4, and Nanog target genes in mES cells, as determined by Pol II Ser5P, H3K4me3 (initiation-associated chromatin modification), H3K79me2 (elongation-associated chromatin modification) and H3K27me3 (repressive chromatin modification). Each target gene set was rank ordered based on the amount of Pol II bound at each gene, from the highest amount of Pol II to the lowest amount and the enrichment of the indicated chromatin modification or Pol II is displayed from -2.5kb to +3kb surrounding each annotated transcription start site. Blue indicates enrichment and white indicates no enrichment. (C) c-Myc target genes have lower TR values than non-target genes. Histograms were made for the number of genes with a given TR values for high confidence c-Myc target genes and non-target genes. Genes with lower TR values are less paused than genes with higher TR values. See also Figure S5.
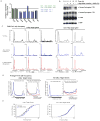
Figure 6. c-Myc inhibition effects transcription at the pause release step
(A) RNA was extracted from mES cells treated with 10058-F4 or vehicle alone (DMSO) for 6 hours and used to generate cDNA using reverse transcription. Expression change was calculated for 10058-F4 treated cells compared vehicle alone control for two non-c-Myc target genes (Brg1, Rnf2 - green) and five c-Myc target genes (Bax, Nol5, Zfp451, Brca2 and Atic - blue) from two independent experiments. Error bars represent s.d. from triplicate qPCR reactions. (B) mES cells were treated with 10058-F4 for either 1.5, 6 or 12 hours. Extracts were analyzed using Western blot using antibodies against Pol II Ser2P CTD, and Pol II Ser5P CTD to determine the levels of the modified forms of Pol II. TBP was used as a loading control. (C) Pol II ChIP-seq binding profiles in mES cells treated with 10058-F4 (c-Myc/Max inhibitor; blue), DMSO alone (black), or flavopiridol (P-TEFb inhibitor; red). Pol II occupancy is shown for three c-Myc target genes (Ncl, Npm1 and Nol5) and two non-cMyc target gene (Txnip and Chpf2). Cells were treated with 10058-F4 or DMSO for 6 hours. See also Figure S6. (D) Average Pol II binding plots for the high confidence cMyc targets and non-c-Myc target genes in no drug (black), and 10058-F4 treatment (blue). The left panel shows the entire gene average. The right panel is a close up of the transcribed region to show the difference in amounts of elongating Pol II density under the different conditions. Also included in the right panel for comparison is elongating Pol II density following flavopiridol treatment (red). (E) Pol II traveling ratio (TR) for the high confidence c-Myc target genes and non-c-Myc target genes following 10058-F4 treatment (blue) or no drug (black). The left panel is the TR for the c-Myc targets and right panel is the TR for non-c-Myc targets. Higher TR values indicate a higher degree of pausing.
Figure 7. Oct4 shutdown reduces Pol II initiation at Oct4-dependent genes
(A) Oct4 protein levels in doxycycline-inducible Oct4 knockdown mES cells following 0, 12 or 24 hours of doxycycline treatment. Extracts were probed with an antibody against Oct4. Brg1 was used as a loading control. (B) Pol II ChIP-seq binding profiles at Oct4 target genes following the indicated time of doxycycline treatment, inducing Oct4 knockdown. Of note, the Oct4 bound genes change Pol II occupancy in both the promoter proximal region and the transcribed region. The panel to the right shows Pol II ChIP-seq binding profiles at non-Oct4 target following the indicated time of doxycycline treatment, inducing Oct4 knockdown. (C) Pol II traveling ratio (TR) as described in Figure 1C for the high confidence Oct4-dependent genes and Oct4 non-target genes after either 0 or 12 hrs of doxycycline treatment. The left panel is the TR for the Oct4 targets and right panel is the TR for non-Oct4 targets.
Comment in
- Regulation of RNA polymerase II elongation by c-Myc.
Price DH. Price DH. Cell. 2010 Apr 30;141(3):399-400. doi: 10.1016/j.cell.2010.04.016. Cell. 2010. PMID: 20434979 - Adding more to the Myc story.
Swami M. Swami M. Nat Rev Cancer. 2010 Jul;10(7):455. doi: 10.1038/nrc2879. Nat Rev Cancer. 2010. PMID: 20589974 No abstract available.
Similar articles
- ZFP281 Recruits MYC to Active Promoters in Regulating Transcriptional Initiation and Elongation.
Luo Z, Liu X, Xie H, Wang Y, Lin C. Luo Z, et al. Mol Cell Biol. 2019 Nov 25;39(24):e00329-19. doi: 10.1128/MCB.00329-19. Print 2019 Dec 15. Mol Cell Biol. 2019. PMID: 31570506 Free PMC article. - The Histone Deacetylase SIRT6 Restrains Transcription Elongation via Promoter-Proximal Pausing.
Etchegaray JP, Zhong L, Li C, Henriques T, Ablondi E, Nakadai T, Van Rechem C, Ferrer C, Ross KN, Choi JE, Samarakkody A, Ji F, Chang A, Sadreyev RI, Ramaswamy S, Nechaev S, Whetstine JR, Roeder RG, Adelman K, Goren A, Mostoslavsky R. Etchegaray JP, et al. Mol Cell. 2019 Aug 22;75(4):683-699.e7. doi: 10.1016/j.molcel.2019.06.034. Epub 2019 Aug 6. Mol Cell. 2019. PMID: 31399344 Free PMC article. - Transcriptional pause release is a rate-limiting step for somatic cell reprogramming.
Liu L, Xu Y, He M, Zhang M, Cui F, Lu L, Yao M, Tian W, Benda C, Zhuang Q, Huang Z, Li W, Li X, Zhao P, Fan W, Luo Z, Li Y, Wu Y, Hutchins AP, Wang D, Tse HF, Schambach A, Frampton J, Qin B, Bao X, Yao H, Zhang B, Sun H, Pei D, Wang H, Wang J, Esteban MA. Liu L, et al. Cell Stem Cell. 2014 Nov 6;15(5):574-88. doi: 10.1016/j.stem.2014.09.018. Epub 2014 Oct 9. Cell Stem Cell. 2014. PMID: 25312495 - BRD4: a general regulator of transcription elongation.
Altendorfer E, Mochalova Y, Mayer A. Altendorfer E, et al. Transcription. 2022 Feb-Jun;13(1-3):70-81. doi: 10.1080/21541264.2022.2108302. Epub 2022 Sep 1. Transcription. 2022. PMID: 36047906 Free PMC article. Review. - 7SKiing on chromatin: Move globally, act locally.
D'Orso I. D'Orso I. RNA Biol. 2016 Jun 2;13(6):545-53. doi: 10.1080/15476286.2016.1181254. Epub 2016 Apr 29. RNA Biol. 2016. PMID: 27128603 Free PMC article. Review.
Cited by
- Transcription factor Sp3 represses expression of p21CIP¹ via inhibition of productive elongation by RNA polymerase II.
Valin A, Ouyang J, Gill G. Valin A, et al. Mol Cell Biol. 2013 Apr;33(8):1582-93. doi: 10.1128/MCB.00323-12. Epub 2013 Feb 11. Mol Cell Biol. 2013. PMID: 23401853 Free PMC article. - Gas6/Axl is the sensor of arginine-auxotrophic response in targeted chemotherapy with arginine-depleting agents.
Tsai WB, Long Y, Park JR, Chang JT, Liu H, Rodriguez-Canales J, Savaraj N, Feun LG, Davies MA, Wistuba II, Kuo MT. Tsai WB, et al. Oncogene. 2016 Mar 31;35(13):1632-42. doi: 10.1038/onc.2015.237. Epub 2015 Jun 22. Oncogene. 2016. PMID: 26096933 Free PMC article. - The roles of the reprogramming factors Oct4, Sox2 and Klf4 in resetting the somatic cell epigenome during induced pluripotent stem cell generation.
Schmidt R, Plath K. Schmidt R, et al. Genome Biol. 2012 Oct 22;13(10):251. doi: 10.1186/gb-2012-13-10-251. Genome Biol. 2012. PMID: 23088445 Free PMC article. Review. - Topoisomerase 1 inhibition suppresses inflammatory genes and protects from death by inflammation.
Rialdi A, Campisi L, Zhao N, Lagda AC, Pietzsch C, Ho JSY, Martinez-Gil L, Fenouil R, Chen X, Edwards M, Metreveli G, Jordan S, Peralta Z, Munoz-Fontela C, Bouvier N, Merad M, Jin J, Weirauch M, Heinz S, Benner C, van Bakel H, Basler C, García-Sastre A, Bukreyev A, Marazzi I. Rialdi A, et al. Science. 2016 May 27;352(6289):aad7993. doi: 10.1126/science.aad7993. Epub 2016 Apr 28. Science. 2016. PMID: 27127234 Free PMC article. - Integrated requirement of non-specific and sequence-specific DNA binding in Myc-driven transcription.
Pellanda P, Dalsass M, Filipuzzi M, Loffreda A, Verrecchia A, Castillo Cano V, Thabussot H, Doni M, Morelli MJ, Soucek L, Kress T, Mazza D, Mapelli M, Beaulieu ME, Amati B, Sabò A. Pellanda P, et al. EMBO J. 2021 May 17;40(10):e105464. doi: 10.15252/embj.2020105464. Epub 2021 Apr 1. EMBO J. 2021. PMID: 33792944 Free PMC article.
References
- Ahn SH, Kim M, Buratowski S. Phosphorylation of serine 2 within the RNA polymerase II C-terminal domain couples transcription and 3′ end processing. Mol Cell. 2004;13:67–76. - PubMed
- Barboric M, Nissen RM, Kanazawa S, Jabrane-Ferrat N, Peterlin BM. NF-kappaB binds P-TEFb to stimulate transcriptional elongation by RNA polymerase II. Mol Cell. 2001;8:327–337. - PubMed
- Bentley DL, Groudine M. A block to elongation is largely responsible for decreased transcription of c-myc in differentiated HL60 cells. Nature. 1986;321:702–706. - PubMed
Publication types
MeSH terms
Substances
Grants and funding
- R01 GM034277-25/GM/NIGMS NIH HHS/United States
- R01 CA146445/CA/NCI NIH HHS/United States
- P01 CA042063/CA/NCI NIH HHS/United States
- P30 CA014051/CA/NCI NIH HHS/United States
- P30-CA14051/CA/NCI NIH HHS/United States
- P01 CA042063-24/CA/NCI NIH HHS/United States
- R01 GM034277/GM/NIGMS NIH HHS/United States
- F32 HD051190/HD/NICHD NIH HHS/United States
- R01 HG002668-07/HG/NHGRI NIH HHS/United States
- P01-CA42063/CA/NCI NIH HHS/United States
- R01-HG002668/HG/NHGRI NIH HHS/United States
- R01 CA146445-02/CA/NCI NIH HHS/United States
- R01-CA133404/CA/NCI NIH HHS/United States
- 5-F32-HD051190/HD/NICHD NIH HHS/United States
- R37 GM034277/GM/NIGMS NIH HHS/United States
- R01 CA133404/CA/NCI NIH HHS/United States
- R01 HG002668/HG/NHGRI NIH HHS/United States
- R01 CA133404-02/CA/NCI NIH HHS/United States
- R01-GM34277/GM/NIGMS NIH HHS/United States
- P30 CA014051-38/CA/NCI NIH HHS/United States
LinkOut - more resources
Full Text Sources
Other Literature Sources
Molecular Biology Databases


