Regulation of learning and memory by meningeal immunity: a key role for IL-4 - PubMed (original) (raw)
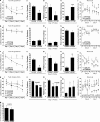
Figure 1.
Depletion of T cells is correlated with impairment of learning and memory in the MWM task. All behavior experiments were performed by an experimenter blinded to the identity of the experimental groups and were recorded with the EthoVision video tracking system. Representative experiments are shown out of at least two to three independently performed in each case. (a, i–v) PBS- (control) and FTY720-treated mice of an identical genetic background (BALB/c) were monitored during the MWM task. During the acquisition (i) and reversal (v) phases of the task, FTY720-treated mice took significantly longer than controls to locate the hidden platform. Two-way repeated measures ANOVA was used for statistical analysis (*, P < 0.05 for overall acquisition; **, P < 0.01 for reversal day 2). The Bonferroni post-hoc test was used for individual pair comparisons (n = 8–9 mice/group; *, P < 0.05; **, P < 0.01). A probe trial was performed on day 5, and the percentage of time spent in the training quadrant (ii), the number of times each mouse passed over a circular space circumscribing the location of the original platform (iii), and the latency to reach the original platform location (iv) were recorded. FTY720-treated mice showed significantly reduced time spent in the training quadrant (ii), passed over the original platform location fewer times (iii), and took significantly longer to successfully locate the original platform location (iv; Student’s t test; *, P < 0.05; ***, P < 0.001). (b, i–v) Control and FTY720-treated SCID mice of an identical genetic background (BALB/c) were monitored during the MWM task. No differences were seen in either the acquisition (i) or reversal phase (v). A probe trial was performed on day 5, and the percentage of time spent in the training quadrant (ii), the number of times each mouse passed over a circular space circumscribing the location of the original platform (iii), and the latency to reach the original platform location (iv) were recorded. FTY720-treated SCID mice did not differ from control SCID mice in time spent in any of the these measures (*, P < 0.05; n = 8–9 mice/group). (c, i–v) Control and anti-VLA4–treated mice of an identical genetic background (BALB/c) were monitored during the MWM task. During the acquisition (i) and reversal (v) phases of the task, anti-VLA4–treated mice took significantly longer than controls to locate the hidden platform. Two-way repeated measures ANOVA was used for statistical analysis (*, P < 0.05; and **, P < 0.01 for both acquisition and reversal). The Bonferroni post-hoc test was used for individual pair comparisons (n = 8 mice/group; *, P < 0.05; **, P < 0.01). During the probe trial, anti-VLA4–treated mice showed significantly reduced time spent in the training quadrant (ii), passed over the original platform location fewer times (iii), and took significantly longer to successfully locate the original platform location (iv; Student’s t test; *, P < 0.05; **, P < 0.01). (d, i–v) Control and long-term FTY720- and anti-VLA4–treated mice of an identical genetic background (BALB/c) were monitored during the MWM task. During the acquisition (i) and reversal (v) phases of the task, both FTY720- and anti-VLA4–treated mice took significantly longer than controls to locate the hidden platform. Two-way repeated measures ANOVA was used for statistical analysis (*, P < 0.05; and **, P < 0.01 for both acquisition and reversal). The Bonferroni post-hoc test was used for individual pair comparisons (n = 6–7 mice/group; *, P < 0.05). During the probe trial, anti-VLA4–treated mice showed significantly reduced time spent in the training quadrant (iii) and took significantly longer to successfully locate the original platform location (iv). FTY70-treated mice passed over the original platform location fewer times (ii) and took significantly longer to successfully locate the original platform location (iv; Student’s t test; *, P < 0.05; ***, P < 0.001). (e) Mice were placed in a conditioning context for 2 min before receiving five tone/shock pairings spaced by 1-min inter-trial intervals. 48 h later the mice received a 5-min test in the training context. Freezing was scored via an automated system during all sessions and used as an index of memory. No differences were seen between control and FTY720-treated mice. Error bars represent SEM.
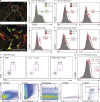
Figure 2.
Accumulation and activation of IL-4–producing T cells in the meningeal spaces of MWM-trained mice. (a and b) Whole brain cryosections were labeled for CD3. Subarachnoid spaces occupied by CD3+ cells are presented, and arrowheads point to CD3+ cells. Bar, 50 µm (a). CD3+ cells were stereologically counted. A significant increase in CD3+ cells was found in trained mice (b). (c, i–iii) Meningeal single-cell suspensions were examined by FACS for CD3+/CD4+ cells in naive and MWM-trained mice. In each sample, 104 CD45hi events were examined (i); CD45hi events were gated by scatter (ii), and CD4 versus CD3, revealing an increase in CD4+ T cells in the meninges of trained mice (iii). Experiments were performed three separate times with meninges pooled from four mice with similar results. The FACS plot shown is representative (c, iv). (d) The entirety of one single sample from each group (naive or MWM-trained) was read by FACS and normalized to one another by CD45hi count and gated on CD3, CD4, and CD8. The numbers of CD3+/CD4+ and CD3+/CD8+ cells obtained from each sample were multiplied by the total number of samples prepared from the group and divided by four (the number of mice in the group) to arrive at a representative CD4+ and CD8+ T cell count per single mouse meninges. Meningeal preparations from MWM-trained mice displayed significantly higher numbers of CD4+ but not CD8+ T cells than meningeal preparations from naive mice. Error bars represent SEM. (e and f) CD3+ cells from meninges of naive and MWM-trained mice were examined for expression of the activation markers CD69 and CD25, and the cytokines IL-4 and IFN-γ. CD4+ but not CD8+ cells from MWM-trained mice showed approximately threefold up-regulation in expression of CD69 (e) and similar up-regulation in effector (Foxp3−) T cells expressing CD25 (f) as compared with cells from naive mice. Cells from MWM-trained mice also showed a substantial increase in intracellular expression of IL-4 but not IFN-γ as compared with naive animals (g). (h–k) FACS analysis of meningeal isolates from MWM-trained FTY720-treated and control mice (h and i), and anti-VLA4–treated and control mice (j and k). Analysis of CD3+ cells from meninges of FTY720-treated mice indicates a reduction in meningeal CD4+ T cells as compared with controls; numbers indicate cell counts and reflect the analyzed sample rather than the content of the entire meningeal isolation (h); a specific reduction in CD44loCD62L+ (TNaive) subpopulation in FTY720-treated mice is presented (i). Anti-VLA4–treated mice exhibit reduction in meningeal CD4+ T cells as compared with controls (j), particularly the subpopulation characterized by the CD44hi/CD62L− (TEffector Memory) phenotype (k). At least two independent experiments with at least four mice in each group were performed. Results from independent experiments are shown. Numbers indicate percentages.
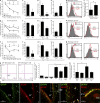
Figure 3.
T cell–dependent regulation of meningeal myeloid cell phenotype in MWM-trained mice. (a) Whole brain cryosections were double labeled for CD68 and MHCII. Positive cells (myeloid) in the choroid plexus of the third ventricle are presented. Bars, 50 µm. (b–e) FACS analyses were performed at least three times independently with at least three to four mice in each group. Numbers on histograms indicate actual cell counts. CD11b+ cells from meninges of MWM-trained animals display a marked increase in the expression of CD69 as compared with naive animals (b). CD11b+ cells from the meninges of acutely immunosuppressed FTY720-treated animals show a proinflammatory skew as measured by TNF and IL-12 expression (c). Anti-VLA4–treated animals display an increase in the expression of the proinflammatory cytokine IL-12 in meningeal myeloid cells (d). CD11b+ cells from the meninges of chronically immunodeficient SCID mice display a proinflammatory skew in comparison to controls, as measured by TNF and IL-12 expression (e). (f and g) SCID mice injected i.p. with PBS, 2 X 10⁶ T lymphocytes from IL-4−/− mice, or 2 X 10⁶ T lymphocytes from wild-type mice. At least six mice in each group were analyzed in two independent experiments. Plots depict CD3+/CD4+cells isolated from the meninges of transfused SCID mice (numbers indicate percentages; f). Histograms show TNF expression as measured by FACS analysis of meningeal cells expressing CD11b. CD11b+ cells from the meninges of SCID mice transfused with wild-type T cells showed a reduction in proinflammatory cytokine production, and SCID mice transfused with T cells from IL-4−/− mice showed no such reduction (g). (h) Representative labeling and gating scheme for meningeal myeloid cells in b–e and g by FACS is presented. Viable cells as determined by a live/dead gate (i), forward and side scatter to eliminate debris (ii), CD45hi cells to eliminate possible microglial contamination (iii), and single-cell selection as determined by pulse width versus area gate (iv), CD11b+ gate. CD45/event count gates were adjusted to yield identical numbers (3 X 10³) of myeloid-derived cells in each sample.
Figure 4.
T cell–derived IL-4 regulates meningeal myeloid cell phenotype and influences learning and memory. All behavior experiments were performed by an experimenter blinded to the identity of experimental groups and were recorded with the EthoVision video tracking system. Representative experiments are shown out of at least two to three independently performed in each case. (a, i–iv) Control and IL-4−/− mice of identical genetic background (C57BL/6J) were monitored during the MWM task performance. During the acquisition (i) phase of the task, IL-4−/− mice took significantly longer than controls to locate the hidden platform. Two-way repeated measures ANOVA was used for statistical analysis (***, P < 0.001). During the probe trial, IL-4−/− mice showed significantly reduced time spent in the training quadrant (ii), passed over the original platform location fewer times (iii), and took significantly longer to successfully locate the original platform location (iv; Student’s t test; *, P < 0.05; **, P < 0.01; ***, P < 0.001). (b, e, and g) Meningeal isolates from mice were labeled for viability, CD45, singlet cells, and CD11b to allow exact comparison of cells (see Fig. 3 h for detailed gating strategy). Cells were also labeled for IL-12 and/or TNF expression. Histograms represent comparative proinflammatory cytokine production of 3 × 10³ viable, CD45hi, CD11b+ singlet cells from each group. Numbers on the histograms indicate actual cell counts. Meningeal isolates from MWM-trained wild-type and IL-4−/− mice demonstrate increased production of TNF by CD11b+ cells in IL-4−/− mice (b). FACS data shown are from one out of two independent experiments with similar results and are representative. (c) Hippocampal tissue from wild-type and IL-4−/− mice was compared by qRT-PCR for relative levels of TNF mRNA expression; hippocampal isolates from IL-4−/− mice displayed significantly higher levels of TNF mRNA. One-way ANOVA was used for statistical analysis (*, P < 0.05; n = 4 from each group; experiment was repeated two times). (d, i–iv) Lethally irradiated wild-type mice reconstituted with bone marrow from wild-type or IL-4−/− mice were monitored during the MWM task performance. During the acquisition (i) phase of the task, mice that had received IL-4−/− bone marrow took significantly longer than controls to locate the hidden platform. Two-way repeated measures ANOVA was used for statistical analysis (n = 7 in each group; *, P < 0.05; **, P < 0.01). During the probe trial, mice that had received IL-4−/− bone marrow passed over the original platform location significantly fewer times (iii) and took significantly longer to successfully locate the original platform location (iv; Student’s t test; *, P < 0.05; **, P < 0.01). (e) Meningeal isolates were prepared from each group (n = 4 pooled samples), labeled as described, and analyzed by FACS. CD11b+ cells from mice that received bone marrow from IL-4−/− mice demonstrated increased levels of IL-12 and TNF. (f, i–iv) IL-4−/− mice received i.p. injection of 2 × 10⁶ T cells from wild-type mice (expressing GFP under the UBC promoter) or IL-4−/− mice, and were tested after 2 wk in the MWM. During the acquisition (i) phase of the task, mice that had received IL-4−/− T cells took significantly longer than wild-type T cell–injected mice to locate the hidden platform. Two-way repeated measures ANOVA was used for statistical analysis (n = 8 in each group; *, P < 0.05; **, P < 0.01). During the probe trial, mice that had received IL-4−/− T cells showed significantly reduced time spent in the training quadrant (ii), passed over the original platform location significantly fewer times (iii), and took significantly longer to successfully locate the original platform location as compared with mice receiving T cells from wild-type donors (iv; Student’s t test; *, P < 0.05). (g) Meningeal isolates were prepared from each group (n = 4 pooled samples), labeled as described, and analyzed by FACS. CD11b+ cells from mice that received IL-4−/− T cells mice demonstrated increased levels of IL-12 and TNF compared with wild-type T cell–injected mice. (h) Meningeal isolates from IL-4−/− mice that received GFP+ T cells were also labeled extracellularly for CD3 and CD4, and intracellularly for IFN-γ and IL-4. GFP+ (wild-type, transferred) and GFP− (endogenous) CD4+ T cells were compared for expression of intracellular cytokines. GFP+ T cells expressed high levels of IL-4 and low levels of IFN-γ, whereas GFP− T cells expressed no IL-4 and high levels of IFN-γ. Numbers indicate percentages. (i) Primary cultures of astrocytes from wild-type mice were treated with 10 ng/ml of various recombinant cytokines. After 8 h, mRNA was isolated from astrocyte cultures and analyzed by qRT-PCR. Relative expression of BDNF mRNA under different treatment conditions is presented. One-way ANOVA was used for statistical analysis (*, P < 0.05). One representative experiment out of two independently performed experiments is presented. (j) Representative confocal images of astrocytes (glial fibrillary acidic protein; GFAP) lining the borders of the brain expressing BDNF are presented. Arrows indicate examples for areas of colocalization. DG, dentate gyrus; LV, lateral ventricle; 3rdV, third ventricle. (k) Hippocampi from naive and MWM-trained wild-type and IL-4−/− mice were examined for BDNF expression using qRT-PCR. Relative levels of BDNF mRNA expression are presented. One-way ANOVA was used for statistical analysis (**, P < 0.01; n = 4 from each group). One representative experiment out of three independently performed experiments is presented. Error bars represent SEM.


