Genetic evidence for hybrid trait speciation in heliconius butterflies - PubMed (original) (raw)
Genetic evidence for hybrid trait speciation in heliconius butterflies
Camilo Salazar et al. PLoS Genet. 2010.
Abstract
Homoploid hybrid speciation is the formation of a new hybrid species without change in chromosome number. So far, there has been a lack of direct molecular evidence for hybridization generating novel traits directly involved in animal speciation. Heliconius butterflies exhibit bright aposematic color patterns that also act as cues in assortative mating. Heliconius heurippa has been proposed as a hybrid species, and its color pattern can be recreated by introgression of the H. m. melpomene red band into the genetic background of the yellow banded H. cydno cordula. This hybrid color pattern is also involved in mate choice and leads to reproductive isolation between H. heurippa and its close relatives. Here, we provide molecular evidence for adaptive introgression by sequencing genes across the Heliconius red band locus and comparing them to unlinked wing patterning genes in H. melpomene, H. cydno, and H. heurippa. 670 SNPs distributed among 29 unlinked coding genes (25,847bp) showed H. heurippa was related to H. c. cordula or the three species were intermixed. In contrast, among 344 SNPs distributed among 13 genes in the red band region (18,629bp), most showed H. heurippa related with H. c. cordula, but a block of around 6,5kb located in the 3' of a putative kinesin gene grouped H. heurippa with H. m. melpomene, supporting the hybrid introgression hypothesis. Genealogical reconstruction showed that this introgression occurred after divergence of the parental species, perhaps around 0.43Mya. Expression of the kinesin gene is spatially restricted to the distal region of the forewing, suggesting a mechanism for pattern regulation. This gene therefore constitutes the first molecular evidence for adaptive introgression during hybrid speciation and is the first clear candidate for a Heliconius wing patterning locus.
Conflict of interest statement
The authors have declared that no competing interests exist.
Figures
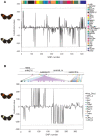
Figure 1. Relative likelihood of association between H. heurippa and H. m. melpomene versus H. c. cordula for (A) genes unlinked to color pattern and (B) across the HmB red color pattern locus.
Likelihood values are plotted for each variable position, where positive likelihood values indicate a SNP position at which H. heurippa and H. m. melpomene are more similar, and negative values a position at which H. heurippa shows a stronger association with H. c. cordula. Fixed sites are indicated by dotted lines showing a likelihood value of 244 for a complete association of H. heurippa with H. m. melpomene and −244 for that with H. c. cordula. Colors represent different coding regions. The majority of unlinked SNPs (634) show shared polymorphism among the three species (240> ΔLnL >−240). At unlinked loci, H. heurippa and H. c. cordula shared fixed polymorphism at only 8 SNPs whereas H. heurippa and H. m. melpomene did not share any fixed polymorphism. For the HmB locus, sequenced BAC clones are indicated above the gene annotation .
Figure 2. Distribution of average likelihood values at SNPs in unlinked and HmB linked loci.
The average of likelihood values for each unlinked marker and for 1,000 bp windows in the HmB region was calculated. This histogram shows the distribution of these values. Dotted lines represent the 95% two-tailed interval for unlinked genes. The asterisk over the bars indicates those 1,000 bp windows showing average values that lie outside the unlinked genes distribution (p<0,005). Positive values outside that distribution correspond to 3′ kinesin whereas negative values are those in kin_2.
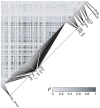
Figure 3. HmB linkage disequilibrium analysis.
Pairwise estimates of linkage disequilibrium (r2) among 199 SNPs in the HmB locus (those with a rare allele frequency less than 10% were excluded) for combined H. c. cordula and H. heurippa population samples. Physical distance between sites is shown in the adjacent map.
Figure 4. Gene genealogies for 3′ kinesin and its flanking regions.
(A) sorting nexin (sdp); (B) 3′ kinesin; and (C) 5′ kinesin partial sequence (kin_2). Filled color circles represent alleles of each species. The 3′ kinesin tree is rooted with H. numata as outgroup (black). Numbers above and below the branches are bootstrap support values for likelihood and parsimony analyses respectively. (B) shows H. heurippa most closely related to H. m. melpomene, while (A,C), the genomic regions surrounding 3′ kinesin, show H. heurippa alleles more closely related to H. c. cordula. A similar tree topology was obtained from an amino acid alignment (data not shown).
Figure 5. Expression pattern of kinesin in forewings.
Of (A) H. m. cythera and (B) H. cydno. A similar expression pattern to that present in (A) is also observed in H. m. rosina forewings (Figure S3), consistent with the red band phenotype of these two races. The lack of any localized kinesin expression in H. cydno forewings is consistent with the absence of a red band in this species. (C) Model of how kinesin expression (K, solid line), might interact with an unknown gene (X, dotted line) to regulate forewing red band expression.
Similar articles
- Introgression of wing pattern alleles and speciation via homoploid hybridization in Heliconius butterflies: a review of evidence from the genome.
Brower AV. Brower AV. Proc Biol Sci. 2012 Dec 12;280(1752):20122302. doi: 10.1098/rspb.2012.2302. Print 2013 Feb 7. Proc Biol Sci. 2012. PMID: 23235702 Free PMC article. Review. - Assortative mating preferences among hybrids offers a route to hybrid speciation.
Melo MC, Salazar C, Jiggins CD, Linares M. Melo MC, et al. Evolution. 2009 Jun;63(6):1660-5. doi: 10.1111/j.1558-5646.2009.00633.x. Evolution. 2009. PMID: 19492995 - Hybrid incompatibility is consistent with a hybrid origin of Heliconius heurippa Hewitson from its close relatives, Heliconius cydno Doubleday and Heliconius melpomene Linnaeus.
Salazar CA, Jiggins CD, Arias CF, Tobler A, Bermingham E, Linares M. Salazar CA, et al. J Evol Biol. 2005 Mar;18(2):247-56. doi: 10.1111/j.1420-9101.2004.00839.x. J Evol Biol. 2005. PMID: 15715831 - Review. Hybrid trait speciation and Heliconius butterflies.
Jiggins CD, Salazar C, Linares M, Mavarez J. Jiggins CD, et al. Philos Trans R Soc Lond B Biol Sci. 2008 Sep 27;363(1506):3047-54. doi: 10.1098/rstb.2008.0065. Philos Trans R Soc Lond B Biol Sci. 2008. PMID: 18579480 Free PMC article. Review. - Speciation by hybridization in Heliconius butterflies.
Mavárez J, Salazar CA, Bermingham E, Salcedo C, Jiggins CD, Linares M. Mavárez J, et al. Nature. 2006 Jun 15;441(7095):868-71. doi: 10.1038/nature04738. Nature. 2006. PMID: 16778888
Cited by
- Genomics of Evolutionary Novelty in Hybrids and Polyploids.
Nieto Feliner G, Casacuberta J, Wendel JF. Nieto Feliner G, et al. Front Genet. 2020 Jul 28;11:792. doi: 10.3389/fgene.2020.00792. eCollection 2020. Front Genet. 2020. PMID: 32849797 Free PMC article. Review. - Introgression of wing pattern alleles and speciation via homoploid hybridization in Heliconius butterflies: a review of evidence from the genome.
Brower AV. Brower AV. Proc Biol Sci. 2012 Dec 12;280(1752):20122302. doi: 10.1098/rspb.2012.2302. Print 2013 Feb 7. Proc Biol Sci. 2012. PMID: 23235702 Free PMC article. Review. - Predictors of genomic differentiation within a hybrid taxon.
Cuevas A, Eroukhmanoff F, Ravinet M, Sætre GP, Runemark A. Cuevas A, et al. PLoS Genet. 2022 Feb 11;18(2):e1010027. doi: 10.1371/journal.pgen.1010027. eCollection 2022 Feb. PLoS Genet. 2022. PMID: 35148321 Free PMC article. - Genetic analysis of hybridization between white-handed (Hylobates lar) and pileated (Hylobates pileatus) gibbons in a contact zone in Khao Yai National Park, Thailand.
Markviriya D, Asensio N, Brockelman WY, Jeratthitikul E, Kongrit C. Markviriya D, et al. Primates. 2022 Jan;63(1):51-63. doi: 10.1007/s10329-021-00958-y. Epub 2021 Oct 29. Primates. 2022. PMID: 34716489 - Sex chromosome mosaicism and hybrid speciation among tiger swallowtail butterflies.
Kunte K, Shea C, Aardema ML, Scriber JM, Juenger TE, Gilbert LE, Kronforst MR. Kunte K, et al. PLoS Genet. 2011 Sep;7(9):e1002274. doi: 10.1371/journal.pgen.1002274. Epub 2011 Sep 8. PLoS Genet. 2011. PMID: 21931567 Free PMC article.
References
- Kirkpatrick M, Ravigné M. Speciation by natural and sexual selection: models and experiments. Am Nat. 2002;159:S22–S35. doi: 10.1086/338370. - DOI - PubMed
- Coyne JA, Orr HA. Speciation. Sunderland, Mass.: Sinauer Associates; 2004.
- Nosil P, Funk DJ, Ortiz-Barrientos D. Divergent selection and heterogeneous genomic divergence. Mol Ecol. 2009;18:375–402. doi: 310.1111/j.1365-1294X.2008.03946.x. - PubMed
- Ortiz-Barrientos D, Counterman BA, Noor MA. The genetics of speciation by reinforcement. PLoS Biol. 2004;2:e416. doi: 410.1371/journal.pbio.0020416. - PMC - PubMed
- Turner TL, Hahn MW, Nuzhdin SV. Genomic islands of speciation in Anopheles gambiae. PLoS Biol. 2005;3:e285. doi: 210.1371/journal.pbio.0030285. - PMC - PubMed
Publication types
MeSH terms
LinkOut - more resources
Full Text Sources


