Induction of regulatory T cells decreases adipose inflammation and alleviates insulin resistance in ob/ob mice - PubMed (original) (raw)
Induction of regulatory T cells decreases adipose inflammation and alleviates insulin resistance in ob/ob mice
Yaron Ilan et al. Proc Natl Acad Sci U S A. 2010.
Abstract
Leptin-deficient ob/ob mice are overweight, develop insulin resistance, and serve as a model for type 2 diabetes (T2D). Studies suggest that inflammatory pathways are linked to the development of insulin resistance and T2D both in animals and humans. We asked whether the induction of regulatory T cells (Tregs) could alleviate the pathological and metabolic abnormalities in ob/ob mice. We induced TGF-beta-dependent CD4(+) latency-associated peptide (LAP)-positive Tregs by oral administration of anti-CD3 antibody plus beta-glucosylceramide. We found a decrease in pancreatic islet cell hyperplasia, fat accumulation in the liver, and inflammation in adipose tissue, accompanied by lower blood glucose and liver enzymes. In addition, treated animals had decreased CD11b(+)F4/80(+) macrophages and TNF-alpha in adipose tissue. Adoptive transfer of orally induced CD4(+)LAP(+) Tregs ameliorated metabolic and cytokine abnormalities. Our results demonstrate the importance of inflammation in T2D and identify a unique immunological approach for treatment of T2D by the induction of Tregs.
Conflict of interest statement
Conflict of interest statement: Y.I. and H.L.W. are consultants for Nasvax.
Figures
Fig. 1.
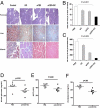
Oral anti (a)-CD3 + GC reduces hepatic fat accumulation and pancreatic hyperplasia. (A) Thirty days after oral treatment, H&E staining of the pancreas and muscle and oil-red-O staining of the liver from ob/ob mice (10 per group) were carried out. Five fields per mouse per group were analyzed. Representative pictures are shown. All pictures were taken at a magnification of ×10. (B) Quantification of the pancreatic islet cell area was carried out by examining five fields of 10 islets per field per mouse in each treatment group. Slides were examined at a magnification of ×10 in a blindfolded fashion. Data bars represent average percentages of islet areas in each treatment group. (C) Quantification of the fat area in liver (pixels × 1,000 per field). All slides were read in a random fashion, blinded to treatment group. These experiments were repeated twice with the same results. Error bars represent SD. The ob/ob mice (eight per group) were fed PBS or a-CD3 + GC for 5 consecutive days. Glucose (D), AST (E), and cholesterol (F) levels in ob/ob mice were examined on day 30 following feeding. Data points represent individual mice. The means of each group are indicated by crossbars.
Fig. 2.
Production of TGF-β and IL-10 in the MLN, pancreas, and gut following oral administration of anti (a)-CD3 + GC. (A) TGF-β, IL-10, IL-2, and IFN-γ levels were measured in MLN cells (10 mice per group) following in vitro anti-CD3 stimulation (1 μg/mL) 5 days after the last treatment. TGF-β (B) and IL-10 (C) content in supernatants from homogenized pancreas and gut was measured 10 days after the last treatment. These experiments were repeated twice with same results. Error bars represent SD.
Fig. 3.
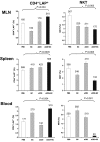
Oral anti (a)-CD3 + GC increases CD4+LAP+ cells and decreases NKT cells in MLN, spleen, and blood. The percentages of CD4+LAP+ T cells and NKT cells were measured by FACS analysis in MLN, spleen, and blood of ob/ob mice (10 per group) fed with a-CD3 + GC, a-CD3, GC, or PBS 5 days after the last treatment. The percentages of CD4+LAP+ T cells and NKT cells in a total of 1 × 10⁴ events are presented. The numbers shown on top of each data bar represent the total number of cells. These experiments were repeated twice with the same results. Error bars represent SD.
Fig. 4.
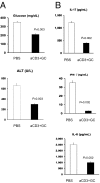
Adoptive transfer of CD4+LAP+ T cells ameliorates metabolic abnormalities and decreases IL-17, IFN-γ, and IL-6 in ob/ob mice. CD4+LAP+ cells (4 × 10⁴) harvested from spleens of ob/ob mice (10 per group) fed anti (a)-CD3 + GC were adoptively transferred into naive ob/ob recipients (5 per group) to measure the effect of CD4+LAP+ cells on the metabolic syndrome (A) and inflammatory cytokine patterns (B) in recipients. Cytokines were measured in splenocytes stimulated with a-CD3 antibodies. These experiments were repeated twice with the same results. Error bars represent SD.
Fig. 5.
Oral anti-CD3 + GC decreases CD11b+F4/80+ macrophages, TNF-α, and IL-1 and increases CD4+Foxp3+ cells in adipose tissue of ob/ob mice. (A) Mice (four per group) were fed PBS or anti-CD3 (5 μg) plus GC (100 μg) for 5 consecutive days. At 72 h after the last feeding, perigonadal white fat was collected and fat paraffin sections were stained with H&E. Pictures were taken at a magnification of ×100. (B) At 72 h after the last feeding (six mice per group), white fat near or surrounding MLNs was used to isolate adipocytes. Adipocytes were stained with fluorescent antibodies to CD11b and F4/80 or CD4 and were then fixed, permeabilized, and stained with antibody to Foxp3. aCD3, anti-CD3. (C) At 72 h after the last feeding, RNA of adipocytes isolated from perigonadal fat was used in quantitative RT-PCR for cytokine expression of IL-10, TNF-α, and TGF-β. (D) CD4+ T cells were negatively selected from spleens of PBS- or anti-CD3 + GC-fed mice and cocultured with adipocytes from control mice at a 1:1 ratio for 5 days. CD4+ T cells were eliminated from coculture by positive selection, leaving adipocytes for extraction of RNA used in quantitative RT-PCR for cytokine expression. These experiments were repeated three times with the same results. Error bars represent SD. (E) Culture supernatants were harvested from cocultures of CD4+ T cells from control or anti-CD3 + GC-fed mice and adipocytes of control mice. The amount of IL-1β was measured by ELISA.
Fig. 6.
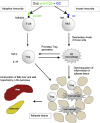
Schematic diagram of the mechanisms of oral anti-CD3 + GC in controlling inflammation.
Similar articles
- Oral administration of immunoglobulin G-enhanced colostrum alleviates insulin resistance and liver injury and is associated with alterations in natural killer T cells.
Adar T, Ben Ya'acov A, Lalazar G, Lichtenstein Y, Nahman D, Mizrahi M, Wong V, Muller B, Rawlin G, Ilan Y. Adar T, et al. Clin Exp Immunol. 2012 Feb;167(2):252-60. doi: 10.1111/j.1365-2249.2011.04511.x. Clin Exp Immunol. 2012. PMID: 22236001 Free PMC article. - Changes in glycemia by leptin administration or high- fat feeding in rodent models of obesity/type 2 diabetes suggest a link between resistin expression and control of glucose homeostasis.
Asensio C, Cettour-Rose P, Theander-Carrillo C, Rohner-Jeanrenaud F, Muzzin P. Asensio C, et al. Endocrinology. 2004 May;145(5):2206-13. doi: 10.1210/en.2003-1679. Epub 2004 Feb 12. Endocrinology. 2004. PMID: 14962997 - Oral administration of visceral adipose tissue antigens ameliorates metabolic disorders in mice and elevates visceral adipose tissue-resident CD4+CD25+Foxp3+ regulatory T cells.
Chen X, Zhang D, Chen X, Meng G, Zheng Q, Mai W, Wu Y, Ye L, Wang L. Chen X, et al. Vaccine. 2017 Aug 16;35(35 Pt B):4612-4620. doi: 10.1016/j.vaccine.2017.07.014. Epub 2017 Jul 21. Vaccine. 2017. PMID: 28736203 - Cellular and molecular players in adipose tissue inflammation in the development of obesity-induced insulin resistance.
Lee BC, Lee J. Lee BC, et al. Biochim Biophys Acta. 2014 Mar;1842(3):446-62. doi: 10.1016/j.bbadis.2013.05.017. Epub 2013 May 22. Biochim Biophys Acta. 2014. PMID: 23707515 Free PMC article. Review. - Adipose-tissue regulatory T cells: Critical players in adipose-immune crosstalk.
Becker M, Levings MK, Daniel C. Becker M, et al. Eur J Immunol. 2017 Nov;47(11):1867-1874. doi: 10.1002/eji.201646739. Epub 2017 Sep 20. Eur J Immunol. 2017. PMID: 28849586 Review.
Cited by
- T cell activation inhibitors reduce CD8+ T cell and pro-inflammatory macrophage accumulation in adipose tissue of obese mice.
Montes VN, Turner MS, Subramanian S, Ding Y, Hayden-Ledbetter M, Slater S, Goodspeed L, Wang S, Omer M, Den Hartigh LJ, Averill MM, O'Brien KD, Ledbetter J, Chait A. Montes VN, et al. PLoS One. 2013 Jul 2;8(7):e67709. doi: 10.1371/journal.pone.0067709. Print 2013. PLoS One. 2013. PMID: 23844072 Free PMC article. - Altered distribution of regulatory lymphocytes by oral administration of soy-extracts exerts a hepatoprotective effect alleviating immune mediated liver injury, non-alcoholic steatohepatitis and insulin resistance.
Khoury T, Ben Ya'acov A, Shabat Y, Zolotarovya L, Snir R, Ilan Y. Khoury T, et al. World J Gastroenterol. 2015 Jun 28;21(24):7443-56. doi: 10.3748/wjg.v21.i24.7443. World J Gastroenterol. 2015. PMID: 26139990 Free PMC article. - Galectin-3 deficiency accelerates high-fat diet-induced obesity and amplifies inflammation in adipose tissue and pancreatic islets.
Pejnovic NN, Pantic JM, Jovanovic IP, Radosavljevic GD, Milovanovic MZ, Nikolic IG, Zdravkovic NS, Djukic AL, Arsenijevic NN, Lukic ML. Pejnovic NN, et al. Diabetes. 2013 Jun;62(6):1932-44. doi: 10.2337/db12-0222. Epub 2013 Jan 24. Diabetes. 2013. PMID: 23349493 Free PMC article. - Induction of immunological tolerance by oral anti-CD3.
da Cunha AP, Weiner HL. da Cunha AP, et al. Clin Dev Immunol. 2012;2012:425021. doi: 10.1155/2012/425021. Epub 2011 Nov 14. Clin Dev Immunol. 2012. PMID: 22162715 Free PMC article. Review. - Regulatory T cells (Tregs) in liver fibrosis.
Wu KJ, Qian QF, Zhou JR, Sun DL, Duan YF, Zhu X, Sartorius K, Lu YJ. Wu KJ, et al. Cell Death Discov. 2023 Feb 9;9(1):53. doi: 10.1038/s41420-023-01347-8. Cell Death Discov. 2023. PMID: 36759593 Free PMC article. Review.
References
- Pelleymounter MA, et al. Effects of the obese gene product on body weight regulation in ob/ob mice. Science. 1995;269:540–543. - PubMed
- Cohen B, Novick D, Rubinstein M. Modulation of insulin activities by leptin. Science. 1996;274:1185–1188. - PubMed
- Macia L, et al. Impairment of dendritic cell functionality and steady-state number in obese mice. J Immunol. 2006;177:5997–6006. - PubMed
- Palmer G, et al. Indirect effects of leptin receptor deficiency on lymphocyte populations and immune response in db/db mice. J Immunol. 2006;177:2899–2907. - PubMed
- Hotamisligil GS, Shargill NS, Spiegelman BM. Adipose expression of tumor necrosis factor-alpha: Direct role in obesity-linked insulin resistance. Science. 1993;259:87–91. - PubMed
MeSH terms
Substances
LinkOut - more resources
Full Text Sources
Other Literature Sources
Molecular Biology Databases
Research Materials
Miscellaneous


