Mechanistic links between Na+ channel (SCN5A) mutations and impaired cardiac pacemaking in sick sinus syndrome - PubMed (original) (raw)
Comparative Study
Mechanistic links between Na+ channel (SCN5A) mutations and impaired cardiac pacemaking in sick sinus syndrome
Timothy D Butters et al. Circ Res. 2010.
Abstract
Rationale: Familial sick sinus syndrome (SSS) has been linked to loss-of-function mutations of the SCN5A gene, which result in decreased inward Na(+) current, I(Na). However, the functional role of I(Na) in cardiac pacemaking is controversial, and mechanistic links between mutations and sinus node dysfunction in SSS are unclear.
Objective: To determine mechanisms by which the SCN5A mutations impair cardiac pacemaking.
Methods and results: Action potential (AP) models for rabbit sinoatrial node (SAN) cells were modified to incorporate experimentally reported I(Na) changes induced by 2 groups of SCN5A gene mutations (affecting the activation and inactivation of I(Na), respectively). The cell models were incorporated into an anatomically detailed 2D model of the intact SAN-atrium. Effects of the mutations and vagal nerve activity on cardiac pacemaking at the single-cell and tissue levels were studied. Multielectrode extracellular potential recordings of activation pattern from intact SAN-atrium preparations were performed to test predictions of the models. At the single-cell level, the mutations slowed down pacemaking rates in peripheral, but not in central SAN cells that control the heart rhythm. However, in tissue simulations, the mutations not only slowed down pacemaking, but also compromised AP conduction across the SAN-atrium, leading to a possible SAN exit block or sinus arrest, the major features of SSS. Simulated vagal nerve activity amplified the bradycardiac effects of the mutations. Two groups of SCN5A mutations showed subtle differences in impairing the ability of the SAN to drive the surrounding atrium, primarily attributable to their differential effects on atrial excitability and conduction safety. Experimental data with tetrodotoxin and carbachol confirmed the simulation outcomes.
Conclusions: Our study substantiates the causative link between SCN5A gene mutations and SSS and illustrates mechanisms by which the mutations impair the driving ability of the SAN.
Figures
Figure 1
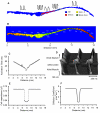
Model of the rabbit SAN and surrounding atrial tissue. A: colour-coded distribution of cell types throughout the 2D tissue slice. Insets show respective single cell APs. B: spatial distribution of the activation time during normal AP conduction through the 2D slice (rainbow palette). Lines are isochrones and numbers are activation time in ms. C: activation time profile through the middle of the 2D slice; an open circle shows respective experimental data. D: AP profiles during conduction through the slice. E: gradient in cell capacitance along the slice. F: gradient in the diffusion coefficient along the slice.
Figure 2
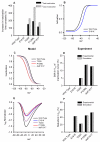
Effects of the SCN5A mutations on Na+ current in SAN cells. A: percentage increase of the fast and slow Na+ channel inactivation time constants from the WT channel to T220I, P1298L, delF1617 and E161K mutant channels. B: simulated steady-state activation curve for Na+ channel. C: simulated steady-state inactivation curves for Na+ channel. D: relative (to the WT channel) shift of the steady-state inactivation curve from experimental data. E: normalised simulated Na+ channel current density. E: percentage reduction in Na+ current density from the WT channel. For mutation parameter values see Online Table I.
Figure 3
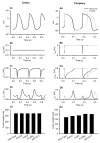
Effects of the SCN5A mutations on the SAN pacemaking rate. Simulated voltage and current recordings from central (i) and peripheral (ii) SAN cells. Effects of the mutation on APs (A), _I_Na (B), _I_Ca,L (C), _I_K,r (D) and PCL (E) shown.
Figure 4
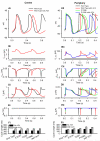
Effects of ACh on the SAN pacemaking rate. Simulated voltage and current recordings from central (i) and peripheral (ii) SAN cells. Effects of the SCN5A mutations and [ACh] = 1.5 ×10⁻⁸ mol/L on APs (A), _I_K,ACh (B), _I_Ca,L (C), _I_f (D), _I_Na (E) and PCL (F) shown.
Figure 5
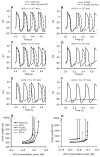
Effects of ACh and the SCN5A mutations on the SAN pacemaking rate. A-F: effects of varying ACh concentrations on AP generation in SAN cells with the WT (left) and mutant (right) channels. G: dependence of PCL on ACh concentration in single cell simulations. H: dependence of PCL on ACh concentration in 2D simulations.
Figure 6
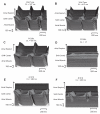
Effects of ACh and the SCN5A mutations on AP conduction. AP profiles in the 2D tissue with [ACh] = 0 (left) and [ACh] = 1.5 ×10⁻⁸ mol/L (right) are shown. A, B: tissue with the WT channel. C, D: tissue with the P1298L mutant channel. E, F: tissue with the E161K mutant channel.
Figure 7
Effects of ACh and the SCN5A mutations on AP conduction parameters: activation times with the E161K mutation and ACh (A) and the P1298L mutation (B) as compared to the WT channel; conduction velocities with the E161K mutation and ACh (C) and the P1298L mutation (D) as compared to the WT channel; d_V_/d_t_max with the E161K mutation and ACh (E) and the P1298L mutation (F) as compared to the WT channel. [ACh] = 1.5 ×10⁻⁸ mol/L.
Figure 8
Experimental validation of the SAN-atrium tissue model. Isolated SAN-atrium tissue with superimposed activation maps (top) show increase of the conduction time from the SAN into the RA due to effects of TTX, CCh and their combination (see panel labels). AP conduction velocities and PCLs under all conditions considered match the respective values simulated with the 2D tissue model (bottom). SVC – superior vena cava, IVC – inferior vena cava. The SAN leading pacemaker cite in control is shown with an asterisk.
Similar articles
- Altered sinoatrial node function and intra-atrial conduction in murine gain-of-function Scn5a+/ΔKPQ hearts suggest an overlap syndrome.
Wu J, Zhang Y, Zhang X, Cheng L, Lammers WJ, Grace AA, Fraser JA, Zhang H, Huang CL, Lei M. Wu J, et al. Am J Physiol Heart Circ Physiol. 2012 Apr 1;302(7):H1510-23. doi: 10.1152/ajpheart.00357.2011. Epub 2012 Jan 27. Am J Physiol Heart Circ Physiol. 2012. PMID: 22287583 Free PMC article. - TGF-β1-mediated fibrosis and ion channel remodeling are key mechanisms in producing the sinus node dysfunction associated with SCN5A deficiency and aging.
Hao X, Zhang Y, Zhang X, Nirmalan M, Davies L, Konstantinou D, Yin F, Dobrzynski H, Wang X, Grace A, Zhang H, Boyett M, Huang CL, Lei M. Hao X, et al. Circ Arrhythm Electrophysiol. 2011 Jun;4(3):397-406. doi: 10.1161/CIRCEP.110.960807. Epub 2011 Apr 14. Circ Arrhythm Electrophysiol. 2011. PMID: 21493874 - Sinus node dysfunction following targeted disruption of the murine cardiac sodium channel gene Scn5a.
Lei M, Goddard C, Liu J, Léoni AL, Royer A, Fung SS, Xiao G, Ma A, Zhang H, Charpentier F, Vandenberg JI, Colledge WH, Grace AA, Huang CL. Lei M, et al. J Physiol. 2005 Sep 1;567(Pt 2):387-400. doi: 10.1113/jphysiol.2005.083188. Epub 2005 Jun 2. J Physiol. 2005. PMID: 15932895 Free PMC article. - Genetic Na+ channelopathies and sinus node dysfunction.
Lei M, Huang CL, Zhang Y. Lei M, et al. Prog Biophys Mol Biol. 2008 Oct-Nov;98(2-3):171-8. doi: 10.1016/j.pbiomolbio.2008.10.003. Epub 2008 Nov 5. Prog Biophys Mol Biol. 2008. PMID: 19027778 Review. - SCN5A and sinoatrial node pacemaker function.
Lei M, Zhang H, Grace AA, Huang CL. Lei M, et al. Cardiovasc Res. 2007 Jun 1;74(3):356-65. doi: 10.1016/j.cardiores.2007.01.009. Epub 2007 Jan 19. Cardiovasc Res. 2007. PMID: 17368591 Review.
Cited by
- Frequency-Dependent Properties of the Hyperpolarization-Activated Cation Current, If, in Adult Mouse Heart Primary Pacemaker Myocytes.
Hu W, Clark RB, Giles WR, Kondo C, Zhang H. Hu W, et al. Int J Mol Sci. 2022 Apr 13;23(8):4299. doi: 10.3390/ijms23084299. Int J Mol Sci. 2022. PMID: 35457119 Free PMC article. - Cellular Mechanisms of Sinus Node Dysfunction in Carriers of the _SCN5A_-E161K Mutation and Role of the H558R Polymorphism.
Wilders R. Wilders R. Front Physiol. 2018 Dec 18;9:1795. doi: 10.3389/fphys.2018.01795. eCollection 2018. Front Physiol. 2018. PMID: 30618807 Free PMC article. - A novel computational sheep atria model for the study of atrial fibrillation.
Butters TD, Aslanidi OV, Zhao J, Smaill B, Zhang H. Butters TD, et al. Interface Focus. 2013 Apr 6;3(2):20120067. doi: 10.1098/rsfs.2012.0067. Interface Focus. 2013. PMID: 24427521 Free PMC article. - Sinus Bradycardia in Carriers of the SCN5A-1795insD Mutation: Unraveling the Mechanism through Computer Simulations.
Wilders R. Wilders R. Int J Mol Sci. 2018 Feb 23;19(2):634. doi: 10.3390/ijms19020634. Int J Mol Sci. 2018. PMID: 29473904 Free PMC article. - Biology of the Sinus Node and its Disease.
Choudhury M, Boyett MR, Morris GM. Choudhury M, et al. Arrhythm Electrophysiol Rev. 2015 May;4(1):28-34. doi: 10.15420/aer.2015.4.1.28. Epub 2015 May 30. Arrhythm Electrophysiol Rev. 2015. PMID: 26835096 Free PMC article.
References
- Adan V, Crown LA. Diagnosis and treatment of sick sinus syndrome. Am Fam Physician. 2003;67:1725–1732. - PubMed
- Dobrzynski H, Boyett MR, Anderson RH. New insights into pacemaker activity: Promoting understanding of sick sinus syndrome. Circulation. 2007;115:1921–1932. - PubMed
- Alboni P, Gianfranchi L, Brignole M. Treatment of persistent sinus bradycardia with intermittent symptoms: are guidelines clear? Europace. 2009 (doi:10.1093/europace/eup014) - PubMed
Publication types
MeSH terms
Substances
Grants and funding
- WT_/Wellcome Trust/United Kingdom
- 081809/WT_/Wellcome Trust/United Kingdom
- BBS/B/1678X/BB_/Biotechnology and Biological Sciences Research Council/United Kingdom
- WT/081809/Z/06/Z/WT_/Wellcome Trust/United Kingdom
LinkOut - more resources
Full Text Sources
Medical
Miscellaneous
