mRNA-seq with agnostic splice site discovery for nervous system transcriptomics tested in chronic pain - PubMed (original) (raw)
mRNA-seq with agnostic splice site discovery for nervous system transcriptomics tested in chronic pain
Paul Hammer et al. Genome Res. 2010 Jun.
Abstract
mRNA-seq is a paradigm-shifting technology because of its superior sensitivity and dynamic range and its potential to capture transcriptomes in an agnostic fashion, i.e., independently of existing genome annotations. Implementation of the agnostic approach, however, has not yet been fully achieved. In particular, agnostic mapping of pre-mRNA splice sites has not been demonstrated. The present study pursued dual goals: (1) to advance mRNA-seq bioinformatics toward unbiased transcriptome capture and (2) to demonstrate its potential for discovery in neuroscience by applying the approach to an in vivo model of neurological disease. We have performed mRNA-seq on the L4 dorsal root ganglion (DRG) of rats with chronic neuropathic pain induced by spinal nerve ligation (SNL) of the neighboring (L5) spinal nerve. We found that 12.4% of known genes were induced and 7% were suppressed in the dysfunctional (but anatomically intact) L4 DRG 2 wk after SNL. These alterations persisted chronically (2 mo). Using a read cluster classifier with strong test characteristics (ROC area 97%), we discovered 10,464 novel exons. A new algorithm for agnostic mapping of pre-mRNA splice junctions (SJs) achieved a precision of 97%. Integration of information from all mRNA-seq read classes including SJs led to genome reannotations specifically relevant for the species used (rat), the anatomical site studied (DRG), and the neurological disease considered (pain); for example, a 64-exon coreceptor for the nociceptive transmitter substance P was identified, and 21.9% of newly discovered exons were shown to be dysregulated. Thus, mRNA-seq with agnostic analysis methods appears to provide a highly productive approach for in vivo transcriptomics in the nervous system.
Figures
Figure 1.
Expression of known genes altered in pain. (A) Experimental paradigm. (i) Neuropathic pain was modeled in rats by L5 SNL (“Chung model”), in which the L4 spinal nerve remains anatomically intact but the L4 DRG becomes dysfunctional, rendering the affected animal allodynic, i.e., the animal responds to light touch as if it were a noxious stimulus. (ii) Mechanical allodynia was confirmed prior to euthanasia by von Frey testing of the paw withdrawal threshold, which was abnormal (1.4–2 g) after SNL and normal (8–10 g) in sham-operated controls. (iii) Sequencing libraries were constructed from pools of two L4 DRG from different animals for the 2-wk time point (hence two behavior measurements per sample) and from a single DRG for the later time point (2 mo). RNA was isolated from the L4 DRG, poly(A)-purified, chemically fragmented, converted to a cDNA library, and sequenced. (iv) Resulting sequencing reads (50 bp long) were mapped to the entire rat genome and categorized as uniquely matching reads (UMR), multi-matching reads (MMR), and nonmatching reads (NMR) as detailed in Methods. (B) Gene-level analysis. Expression of each annotated gene was quantified by the total number of UMR mapping to its exons. The gene Gas7 (ENSRNOG00000003492), shown as an example, has 13 annotated exons. Each dot in the graph symbolizes 10 UMR observed. Sequencing depth at 2 wk was several-fold greater than at 2 mo, i.e., more reads were observed for each sample and gene, requiring correction in the comparative analysis. Normalized UMR counts (i.e., number of reads of the given gene per 106 reads obtained) are given in the left column, showing that the gene was induced 3.1-fold after SNL. (Each line marked as “SNL” or “Control” is an independent biological replicate.) (C) Reproducibility between biological replicates across 10,367 known protein-coding genes. Quantification of expression was highly reproducible across a wide range of gene expression levels because of the digital nature of the data. A tight correlation of read counts more than four orders of magnitude is shown. Correlation among biological replicates was high as indicated by a Pearson correlation coefficient of r = 0.99. (Correlation coefficients between all possible pairs in the study are shown in Supplemental Table 2). (D) Exon length versus average read coverage. A minimal exon length of 50 bp is required for a read to “fit” fully into an exon. Efficient quantification of expression by UMR is achieved for exons of ∼100 bp length or greater. Depicted is the relationship between exon length and average read density (normalized to expression levels of individual genes) for the entire data set (all annotated exons). (E) Expression changes in known genes. Approximately 20% of genes were found to be dysregulated in the L4 DRG (after L5 SNL). Results are shown here for 10,367 known protein-coding genes. The absolute number of genes found to be induced or suppressed by more than 1.7-fold is shown. The analysis was designed with a predicted FDR of 0.5% (i.e., 52 genes predicted to be “induced” and “suppressed”). The empirically determined FDR supported the assumption (“Control”) demonstrating that more than 2000 genes were significantly altered in expression (as discussed in detail in Results and Methods). The bar graphs shown are independent biological replicates for both time points studied (2 wk and 2 mo). (F) External validation by published reports. A gene previously known to be strongly induced in the DRG in rat pain models (Bonilla et al. 2002; Costigan et al. 2002; Sun et al. 2002; Valder et al. 2003; Davis-Taber and Scott 2006), Neuropeptide Y, was found by mRNA-seq to be among the most strongly induced genes at both time points studied. A comprehensive list comparing mRNA-seq results with published reports is provided in Supplemental Table 5.
Figure 2.
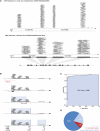
Mapping novel exons in nonannotated regions of the rat genome. (A) Typical UMR distribution. UMR mapped across nonannotated regions of the genome in nonrandom patterns, often resembling exon–intron structure. Depicted are UMR (each gray line = one read) mapped across a nonannotated region of chromosome 5. For comparison, UMR across an annotated region of chromosome 10 are shown along with the annotation of known exons illustrating correspondence. (B) Aggregation of UMR into read “clusters” resembling exons. A 100-bp “sliding window” was moved across the genome demarcating the beginning (UMR present, i.e., “filled” window) and end (UMR absent, i.e., “empty” window) of “UMR clusters.” Resulting UMR clusters differed in read density. Clusters consisting of high piles of hundreds of reads provide strong evidence for an exon, while clusters with few reads appear indeterminate. (C) Classifier for UMR clusters: exon versus no-exon. The newly defined UMR clusters were dichotomized into “exons” and “no exons” using average read density (read coverage) as a classifier. The ROC curve shown here was obtained by applying the classifier to an exploratory subset of 10,367 (annotated) genes, varying read density from 0.25 to 100. Sensitivity and specificity are plotted for 26 different read densities. The classifier was found to be a very precise test with an area under the curve of 0.97. At a read density of 4 (inflection point of the curve indicated as red circle), the sensitivity of the test was 92% and the specificity was 97%. The favorable test characteristics were confirmed in the validation set (sensitivity 91%, specificity of 97%). Applying the procedure to the full data set, 123,066 UMR exon clusters were found. (D) Location of UMR exon clusters. 10,464 new exons were found (i.e., UMR clusters with density >4 in a nonannotated region); the remaining clusters overlapped known exons belonging either to the 10,367 genes quantified above or to other annotated genes.
Figure 3.
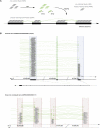
Agnostic splice junction (SJ) mapping. (A) Agnostic, i.e., de novo genome-wide SJ discovery from split reads (25 bp + 25 bp). NMR were split into 25-mer halves, which were matched independently to the genome reference sequence. Reads whose halves each matched uniquely to the genome defined SJs de novo; these were termed uniquely mapping splice junction reads (sjUMR). (B) SJ validation on known genes and their application to define connections of novel exons and exon borders. (Green) SJ-spanning uniquely mapping reads (sjUMR; mapped as described in the Methods section). Most SJs were supported by multiple sjUMR (28.6 on average), as depicted here by piles of green lines. (Top panel) A known gene (Pitpnb ENSRNOG00000000665) is shown here, demonstrating how sjUMR mapped precisely to the border of exons as annotated in the reference genome. (Bottom panel) sjUMR connecting novel UMR clusters to groups, thereby defining new genes. In some instances, UMR cluster borders fall into introns (as a result of the inclusiveness of the sliding-window algorithm), as depicted here (right sides of second and third cluster). In those cases, exon borders were defined precisely by sjUMR. Note (top panel, second exon) that very short (<50 bp) exons that were undetectable by UMR could be defined through mapping of SJ reads.
Figure 4.
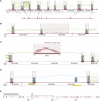
Integrating information from UMR, sjUMR, MMR, and NMR read classes for complex genome (re-)annotation. (A) UMR- and sjUMR-based definition of new exon groups. A novel gene candidate was identified on chromosome 9 through several UMR clusters (satisfying the classifier criterion of a read density > 4), which were connected through splice junctions defined by sjUMR. Expression of exons was coregulated (suppressed by 70% after SNL). An open reading frame encoding 409 amino acids was noted lacking a start and stop codon, suggesting that an incomplete gene fragment was identified consisting of nine exons. (B) sjUMR validation of a low-read density UMR cluster as a novel exon. Consistent with the limited sensitivity of the UMR cluster classifier (91%), a UMR read cluster with a read density of 3.9 was initially not classified as an exon (because its density was <4); but sjUMR-based SJs defined it unambiguously as a novel exon connecting the above gene fragment to a series of 18 3′-located UMR clusters. Note that the cluster density was low because a region of scattered intron reads was added to the read cluster by the sliding window, an imprecision that was rectified by agnostic splice site mapping, which defined precise exon borders. Through the step depicted in this panel, the candidate gene was extended to 28 exons. (_C_) NMR-derived contig bridge. A faulty or missing section in the reference genome can be indicated by runs of _N_ (ambiguous bases) as encountered 3′ of the 28 exons assembled above (50 scattered _N_). Such missing sections in the reference are also an important reason why some mRNA-seq reads do not match. Accordingly, we found that in such cases, contigs of NMR can be assembled bridging faulty sequences, as shown here. As a result of the NMR contig-bridge, the gene candidate could be expanded to 49 exons. (_D_) MMR candidate exons discriminated by sjUMR. Exon copy numbers >1 in the reference sequence result in clusters of MMR (blue) matching collectively to more than one site. A case of two such MMR clusters in close proximity (within <2 kb; note duplicated region indicated by yellow bar) was observed 5′ of the above gene candidate. As shown here, the ambiguity was resolved by sjUMR; this led to a 5′ extension of the gene candidate by another 15 exons, which resulted in a complete gene with start and stop codon consisting of 64 exons. (E) A summary of the novel 64-exon gene is shown encoding a 3313-amino-acid-long protein (14,084-bp mRNA). While the study was under way, a homologous mouse protein with important CNS relevance was reported (“large previously unknown protein”) (Lu et al. 2009), termed UNC-80, which serves as a substance-P and neurotensin coreceptor. Down-regulation of the rat UNC-80 rat homolog after SNL may contribute to allodynia through alterations in peptide activity in the DRG.
Similar articles
- Brain-derived neurotrophic factor increases in the uninjured dorsal root ganglion neurons in selective spinal nerve ligation model.
Fukuoka T, Kondo E, Dai Y, Hashimoto N, Noguchi K. Fukuoka T, et al. J Neurosci. 2001 Jul 1;21(13):4891-900. doi: 10.1523/JNEUROSCI.21-13-04891.2001. J Neurosci. 2001. PMID: 11425916 Free PMC article. - Change in mRNAs for neuropeptides and the GABA(A) receptor in dorsal root ganglion neurons in a rat experimental neuropathic pain model.
Fukuoka T, Tokunaga A, Kondo E, Miki K, Tachibana T, Noguchi K. Fukuoka T, et al. Pain. 1998 Oct;78(1):13-26. doi: 10.1016/S0304-3959(98)00111-0. Pain. 1998. PMID: 9822208 - Upregulation of Cav3.2 T-type calcium channels in adjacent intact L4 dorsal root ganglion neurons in neuropathic pain rats with L5 spinal nerve ligation.
Liu QY, Chen W, Cui S, Liao FF, Yi M, Liu FY, Wan Y. Liu QY, et al. Neurosci Res. 2019 May;142:30-37. doi: 10.1016/j.neures.2018.04.002. Epub 2018 Apr 21. Neurosci Res. 2019. PMID: 29684385 - A comparison of RNA-seq and exon arrays for whole genome transcription profiling of the L5 spinal nerve transection model of neuropathic pain in the rat.
Perkins JR, Antunes-Martins A, Calvo M, Grist J, Rust W, Schmid R, Hildebrandt T, Kohl M, Orengo C, McMahon SB, Bennett DL. Perkins JR, et al. Mol Pain. 2014 Jan 28;10:7. doi: 10.1186/1744-8069-10-7. Mol Pain. 2014. PMID: 24472155 Free PMC article. - Expression of brain-derived neurotrophic factor in rat dorsal root ganglia, spinal cord and gracile nuclei in experimental models of neuropathic pain.
Ha SO, Kim JK, Hong HS, Kim DS, Cho HJ. Ha SO, et al. Neuroscience. 2001;107(2):301-9. doi: 10.1016/s0306-4522(01)00353-0. Neuroscience. 2001. PMID: 11731104
Cited by
- Using a priori knowledge to align sequencing reads to their exact genomic position.
Böttcher R, Amberg R, Ruzius FP, Guryev V, Verhaegh WF, Beyerlein P, van der Zaag PJ. Böttcher R, et al. Nucleic Acids Res. 2012 Sep;40(16):e125. doi: 10.1093/nar/gks393. Epub 2012 May 11. Nucleic Acids Res. 2012. PMID: 22581774 Free PMC article. - DGEclust: differential expression analysis of clustered count data.
Vavoulis DV, Francescatto M, Heutink P, Gough J. Vavoulis DV, et al. Genome Biol. 2015 Feb 20;16(1):39. doi: 10.1186/s13059-015-0604-6. Genome Biol. 2015. PMID: 25853652 Free PMC article. - Phospholipase C δ4 regulates cold sensitivity in mice.
Yudin Y, Lutz B, Tao YX, Rohacs T. Yudin Y, et al. J Physiol. 2016 Jul 1;594(13):3609-28. doi: 10.1113/JP272321. Epub 2016 May 29. J Physiol. 2016. PMID: 27062607 Free PMC article. - Circadian regulation of chemotherapy-induced peripheral neuropathic pain and the underlying transcriptomic landscape.
Kim HK, Lee SY, Koike N, Kim E, Wirianto M, Burish MJ, Yagita K, Lee HK, Chen Z, Chung JM, Abdi S, Yoo SH. Kim HK, et al. Sci Rep. 2020 Aug 14;10(1):13844. doi: 10.1038/s41598-020-70757-w. Sci Rep. 2020. PMID: 32796949 Free PMC article. - Analgesia by inhibiting tetrahydrobiopterin synthesis.
Costigan M, Latremoliere A, Woolf CJ. Costigan M, et al. Curr Opin Pharmacol. 2012 Feb;12(1):92-9. doi: 10.1016/j.coph.2011.10.019. Epub 2011 Dec 15. Curr Opin Pharmacol. 2012. PMID: 22178186 Free PMC article. Review.
References
- Beutler AS, Banck MS, Walsh CE, Milligan ED 2005. Intrathecal gene transfer by adeno-associated virus for pain. Curr Opin Mol Ther 7: 431–439 - PubMed
- Chung JM, Kim HK, Chung K 2004. Segmental spinal nerve ligation model of neuropathic pain. Methods Mol Med 99: 35–45 - PubMed
Publication types
MeSH terms
Substances
Grants and funding
- R01 NS063022/NS/NINDS NIH HHS/United States
- R21 NS062271/NS/NINDS NIH HHS/United States
- R21NS062271/NS/NINDS NIH HHS/United States
- R01NS063022/NS/NINDS NIH HHS/United States
LinkOut - more resources
Full Text Sources
Other Literature Sources
Medical
Miscellaneous


