Deregulation of oncogene-induced senescence and p53 translational control in X-linked dyskeratosis congenita - PubMed (original) (raw)
Deregulation of oncogene-induced senescence and p53 translational control in X-linked dyskeratosis congenita
Cristian Bellodi et al. EMBO J. 2010.
Abstract
Defects in ribosome biogenesis and function are present in a growing list of human syndromes associated with cancer susceptibility. One example is X-linked dyskeratosis congenita (X-DC) in which the DKC1 gene, encoding for an enzyme that modifies ribosomal RNA, is found to be mutated. How ribosome dysfunction leads to cancer remains poorly understood. A critical cellular response that counteracts cellular transformation is oncogene-induced senescence (OIS). Here, we show that during OIS, a switch between cap- and internal ribosome entry site (IRES)-dependent translation occurs. During this switch, an IRES element positioned in the 5'untranslated region of p53 is engaged and facilitates p53 translation. We further show that in DKC1(m) cells, p53 IRES-dependent translation is impaired during OIS ex vivo and on DNA damage in vivo. This defect in p53 translation perturbs the cellular response that counteracts oncogenic insult. We extend these findings to X-DC human patient cells in which similar impairments in p53 IRES-dependent translation are observed. Importantly, re-introduction of wild-type DKC1 restores p53 expression in these cells. These results provide insight into the basis for cancer susceptibility in human syndromes associated with ribosome dysfunction.
Conflict of interest statement
The authors declare that they have no conflict of interest.
Figures
Figure 1
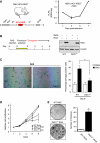
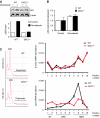
Induction of OIS is impaired in DKC1m cells. (A) Transgenic CMV-HCV-IREST animals harbouring a translational dicistronic-luciferase reporter (left). Primary mouse embryo fibroblasts (MEFs) prepared from CMV-HCV-IREST mice were infected with RAS and the ratio between HCV IRES-mediated Firefly (FL) and cap-dependent Renilla (RL)-luciferase activities was measured at different time points during OIS (right). (B) Experimental design to study OIS after RAS infection of WT and DKC1m primary MEFs. Western blot analysis of RAS levels in WT and DKC1m retrovirally transduced cells. β-actin was used as loading control. (C) Representative images of WT and DKC1m MEFs stained for SA-β-galactosidase. The number of senescent SA-β-galactosidase-positive cells was determined 6 days post-selection. Graph shows mean±s.e.m. of four independent experiments performed in triplicate *_P_=0.04. (D) Representative growth curve of WT and DKC1m cells transduced with empty vector or RAS retroviruses. Relative number of cells±s.e.m. was determined using crystal violet staining and normalized to the cell number at day 1. (E) Clonogenic potential of WT and DKC1m primary MEFs after RAS infection. Images of RAS-infected WT (top) and DKC1m (bottom) cells plated at clonal density (20 000 cells) in a 6 cm plate and cultured for 3 weeks. The number of colonies was determined using standard crystal violet staining (left). Graph shows mean number of colonies±s.e.m. of three independent experiments performed in triplicate *_P_=0.002.
Figure 2
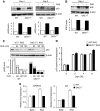
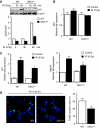
p53 IRES-mediated translation is active during OIS and is reduced in DKC1m cells. (A) Representative analysis of p53 protein levels measured 4 and 6 days post-selection. Densitometry analysis of p53 protein was normalized over β-actin levels in each sample (bottom). (B) RAS-dependent induction of ARF is not impaired in DKC1m cells. Representative western blots showing ARF levels in empty vector and RAS-infected WT and DKC1m cells 4 days post-selection (top). Densitometry analysis of ARF over β-actin levels in each sample is shown (bottom). (C) Assessment of p53 protein turnover 6 days post-selection. Cells were cultured in the presence of 50 μg/ml of CHX and harvested at the indicated time points. Densitometric analysis of p53 over β-actin protein levels in each sample in WT and DKC1m cells (bottom). Numbers represent relative band intensity normalized to the untreated sample for each genotype. (D) Quantification of p53 mRNA levels in RAS-infected WT (white bars) and DKC1m (black bars) cells during OIS was carried out using real-time Q-PCR; graph shows mean±s.e.m. of a representative experiment performed in duplicate. (E) Determination of p21 cip and GADD45 mRNA levels during OIS in WT and DKC1m cells. p21 and GADD45 mRNA levels were measured 6 days post-selection using Q-PCR and normalized over the amount of β-actin messenger in each sample. Graphs show mean±s.e.m. of a representative experiment performed in triplicate.
Figure 3
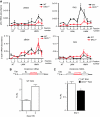
p53 IRES-mediated translation is impaired in DKC1m cells during OIS. (A) Polysomal analysis of p53 and β-actin mRNAs in empty vector (pBabe)- and RAS-infected WT and DKC1m primary MEFs 6 days post-selection. The polysomal association of p53 and β-actin mRNAs was tested by fractionating cytoplasmic lysates through a sucrose gradient and measuring mRNA abundance by Q–PCR analysis in each of the 10 resulting fractions. Graphs show the abundance of p53 (top) and β-actin (bottom) mRNAs in each gradient fraction from pBabe- (left) and RAS-infected (right) WT and DKC1m cells normalized to the corresponding 18S rRNA levels and corrected for the total mRNA content in one representative experiment. *_P_=0.039 was calculated combining three independent experiments. Fractions in the graphs are indicated as NT (not translated), LMW, and HMW (low and high molecular weight polysomes, respectively). (B) RAS-infected WT cells were transduced with a dicistronic reporter mRNA harbouring the p53 IRES element upstream of the Firefly-luciferase ORF. Graph shows mean±s.e.m. of ratios between Firefly and Renilla-luciferase (FL/RL) activities measured 1 and 5 days post-selection. (C) RAS-infected WT and DKC1m cells transduced with a dicistronic reporter mRNA harbouring the p53 IRES element. Graph shows the ratios between Firefly and Renilla-luciferase (FL/RL) activities measured at day 5. *_P_=0.015 was calculated in four independent experiments carried out in triplicate.
Figure 4
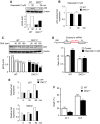
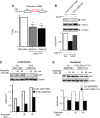
p53 IRES-mediated translation is impaired in DKC1m cells after DNA damage. (A) Cells were cultured in the presence of etoposide and p53 protein levels were analysed at the indicated time by western blot analysis. Densitometry analysis of p53 normalized over β-actin levels is shown. (B) The p53 transcript levels in WT and DKC1m cells cultured in the presence or absence of etoposide were measured by Q–PCR. Mean±s.e.m. of p53 relative expression normalized over the levels of GAPDH mRNA from a representative experiment is shown. (C) Levels of p53 were measured in WT and DKC1m MEFs pre-cultured for 2 h with etoposide and subsequently exposed to CHX. Cells were harvested at the indicated time points. The graph shows the densitometric analysis of p53 over β-actin levels in a representative experiment. (D) WT and DKC1m MEFs were transduced with a dicistronic mRNA harbouring a p53 IRES element. Six hours after transfection, cells were cultured in the presence of 10 μM etoposide for 1 h and the FL/RL ratio was measured. Graph is mean±s.e.m. of FL/RL ratios measured in four independent experiments performed in duplicate *_P_=0.03 and **_P_=0.001. (E) WT and DKC1m MEFs were cultured in the presence of etoposide for the indicated time and p21 and Mdm2 mRNA levels were measured. Graphs show mean±s.e.m. of a representative experiment performed in triplicate. (F) WT and DKC1m cells were cultured in the absence or presence of 100 μM etoposide and cell death was measured by annexin V/PI co-staining after 24 and 48 h. Graph shows mean±s.e.m. of four experiments performed in duplicate; * are _P_=0.03 and _P_=0.01 for 24 and 48 h, respectively.
Figure 5
DKC1m cells show defects in p53 translational control during specific conditions that promote IRES-dependent translation. (A) Western blot analysis of p53 levels in WT and DKC1m cells treated with nocodazole for 18 h (top) and corresponding densitometric analysis normalized over β-actin (bottom). (B) Q–PCR analysis of p53 mRNA normalized over β-actin mRNA levels from total RNA prepared from cells in (A). Graph is mean±s.e.m. of a representative experiment performed in triplicate. (C) Polysomal fractions were prepared from WT and DKC1m MEFs after nocodazole treatment (see Materials and methods). Representative polysomal profiles of nocodazole-treated WT and DKC1m cells (left). The levels of β-actin (top) and p53 (bottom) mRNA were analysed in each polysomal fraction using Q–PCR analysis. The amount of p53 mRNA was normalized over the β-actin mRNA levels in three independent experiments performed in duplicate (right).
Figure 6
p53 function is impaired in vivo in DKC1m mice. (A) Representative western blot of p53 and β-actin protein levels in lysates from freshly isolated WT and DKC1m thymocytes after γ-irradiation. Densitometric analysis of p53 over β-actin levels is shown (bottom). (B) Analysis of p53 and (C) p21 and Mdm2 transcripts levels 1 h post-γ-irradiation were measured by using Q-PCR analysis. Graphs are mean±s.e.m. of one representative experiment. *P<0.01 was calculated combining three independent experiments performed in triplicate. (D) Quantification of γ-irradiation-induced apoptosis in thymocytes isolated from WT and DKC1m mice 6 h post-irradiation. Representative images in which TUNEL staining has been performed are shown. Apoptotic cells are shown in green (TUNEL-positive) and nuclei are shown in blue (DAPI staining). Graph shows percentage of apoptotic cells in WT and DKC1m thymi. Four mice for each genotype were used. *_P_=0.027.
Figure 7
p53 IRES-mediated translation is impaired in human cells derived from X-DC patients. (A) Normal control (Coriell # GM11626) and X-DC human lymphoblasts derived from two affected brothers carrying the missense mutation T66A (Coriell # GM3193 and GM3195) were electroporated with the dicistronic reporter mRNA harbouring a p53 IRES element. The FL/RL ratio was measured 6 h after transfection. Graph is mean±s.e.m. of FL/RL ratios measured in three independent experiments performed in duplicate (*_P_=0.015 and **_P_=0.005). (B) Normal control and X-DC lymphoblasts were electroporated with an empty or a DKC1 WT (DKC1WT) expression vector and p53, DKC1, and β-actin protein levels were measured 12 h post-transfection. Representative protein analysis in one of three experiments is shown. Graph shows densitometric analysis of p53 over β-actin levels. (C) Control and X-DC lymphoblasts were cultured in the absence or presence of etoposide and harvested at the indicated time points. The p53 and β-actin protein levels are shown. (D) Normal (GM05381) and X-DC (GM01774) fibroblasts carrying a deletion of L37 in DKC1 (referred to as DKC1L37del) were cultured in the absence or presence of etoposide. Cells were harvested at the indicated time points and p53 and β-actin protein levels were measured. Densitometric analysis of p53 over β-actin is shown (bottom).
Similar articles
- Impaired control of IRES-mediated translation in X-linked dyskeratosis congenita.
Yoon A, Peng G, Brandenburger Y, Zollo O, Xu W, Rego E, Ruggero D. Yoon A, et al. Science. 2006 May 12;312(5775):902-6. doi: 10.1126/science.1123835. Science. 2006. PMID: 16690864 - Severity of X-linked dyskeratosis congenita (DKCX) cellular defects is not directly related to dyskerin (DKC1) activity in ribosomal RNA biogenesis or mRNA translation.
Thumati NR, Zeng XL, Au HH, Jang CJ, Jan E, Wong JM. Thumati NR, et al. Hum Mutat. 2013 Dec;34(12):1698-707. doi: 10.1002/humu.22447. Epub 2013 Oct 21. Hum Mutat. 2013. PMID: 24115260 - p53 pathway activation by telomere attrition in X-DC primary fibroblasts occurs in the absence of ribosome biogenesis failure and as a consequence of DNA damage.
Carrillo J, González A, Manguán-García C, Pintado-Berninches L, Perona R. Carrillo J, et al. Clin Transl Oncol. 2014 Jun;16(6):529-38. doi: 10.1007/s12094-013-1112-3. Epub 2013 Sep 25. Clin Transl Oncol. 2014. PMID: 24065372 - Guarding the 'translation apparatus': defective ribosome biogenesis and the p53 signaling pathway.
Chakraborty A, Uechi T, Kenmochi N. Chakraborty A, et al. Wiley Interdiscip Rev RNA. 2011 Jul-Aug;2(4):507-22. doi: 10.1002/wrna.73. Epub 2011 Jan 20. Wiley Interdiscip Rev RNA. 2011. PMID: 21957040 Review. - Turning Uridines around: Role of rRNA Pseudouridylation in Ribosome Biogenesis and Ribosomal Function.
Penzo M, Montanaro L. Penzo M, et al. Biomolecules. 2018 Jun 5;8(2):38. doi: 10.3390/biom8020038. Biomolecules. 2018. PMID: 29874862 Free PMC article. Review.
Cited by
- Differential Requirements for eIF4E Dose in Normal Development and Cancer.
Truitt ML, Conn CS, Shi Z, Pang X, Tokuyasu T, Coady AM, Seo Y, Barna M, Ruggero D. Truitt ML, et al. Cell. 2015 Jul 2;162(1):59-71. doi: 10.1016/j.cell.2015.05.049. Epub 2015 Jun 18. Cell. 2015. PMID: 26095252 Free PMC article. - MU-PseUDeep: A deep learning method for prediction of pseudouridine sites.
Khan SM, He F, Wang D, Chen Y, Xu D. Khan SM, et al. Comput Struct Biotechnol J. 2020 Jul 15;18:1877-1883. doi: 10.1016/j.csbj.2020.07.010. eCollection 2020. Comput Struct Biotechnol J. 2020. PMID: 32774783 Free PMC article. - Nucleolar stress: Molecular mechanisms and related human diseases.
Maehama T, Nishio M, Otani J, Mak TW, Suzuki A. Maehama T, et al. Cancer Sci. 2023 May;114(5):2078-2086. doi: 10.1111/cas.15755. Epub 2023 Feb 28. Cancer Sci. 2023. PMID: 36762786 Free PMC article. Review. - The Ribosome Biogenesis-Cancer Connection.
Penzo M, Montanaro L, Treré D, Derenzini M. Penzo M, et al. Cells. 2019 Jan 15;8(1):55. doi: 10.3390/cells8010055. Cells. 2019. PMID: 30650663 Free PMC article. Review. - Dyskeratosis congenita and the DNA damage response.
Kirwan M, Beswick R, Walne AJ, Hossain U, Casimir C, Vulliamy T, Dokal I. Kirwan M, et al. Br J Haematol. 2011 Jun;153(5):634-43. doi: 10.1111/j.1365-2141.2011.08679.x. Epub 2011 Apr 8. Br J Haematol. 2011. PMID: 21477209 Free PMC article.
References
- Artandi SE, Attardi LD (2005) Pathways connecting telomeres and p53 in senescence, apoptosis, and cancer. Biochem Biophys Res Commun 331: 881–890 - PubMed
- Bellodi C, Lidonnici MR, Hamilton A, Helgason GV, Soliera AR, Ronchetti M, Galavotti S, Young KW, Selmi T, Yacobi R, Van Etten RA, Donato N, Hunter A, Dinsdale D, Tirro E, Vigneri P, Nicotera P, Dyer MJ, Holyoake T, Salomoni P et al. (2009) Targeting autophagy potentiates tyrosine kinase inhibitor-induced cell death in Philadelphia chromosome-positive cells, including primary CML stem cells. J Clin Invest 119: 1109–1123 - PMC - PubMed
- Braig M, Lee S, Loddenkemper C, Rudolph C, Peters AH, Schlegelberger B, Stein H, Dorken B, Jenuwein T, Schmitt CA (2005) Oncogene-induced senescence as an initial barrier in lymphoma development. Nature 436: 660–665 - PubMed
Publication types
MeSH terms
Substances
LinkOut - more resources
Full Text Sources
Medical
Molecular Biology Databases
Research Materials
Miscellaneous
