A global network of coexisting microbes from environmental and whole-genome sequence data - PubMed (original) (raw)
A global network of coexisting microbes from environmental and whole-genome sequence data
Samuel Chaffron et al. Genome Res. 2010 Jul.
Abstract
Microbes are the most abundant and diverse organisms on Earth. In contrast to macroscopic organisms, their environmental preferences and ecological interdependencies remain difficult to assess, requiring laborious molecular surveys at diverse sampling sites. Here, we present a global meta-analysis of previously sampled microbial lineages in the environment. We grouped publicly available 16S ribosomal RNA sequences into operational taxonomic units at various levels of resolution and systematically searched these for co-occurrence across environments. Naturally occurring microbes, indeed, exhibited numerous, significant interlineage associations. These ranged from relatively specific groupings encompassing only a few lineages, to larger assemblages of microbes with shared habitat preferences. Many of the coexisting lineages were phylogenetically closely related, but a significant number of distant associations were observed as well. The increased availability of completely sequenced genomes allowed us, for the first time, to search for genomic correlates of such ecological associations. Genomes from coexisting microbes tended to be more similar than expected by chance, both with respect to pathway content and genome size, and outliers from these trends are discussed. We hypothesize that groupings of lineages are often ancient, and that they may have significantly impacted on genome evolution.
Figures
Figure 1.
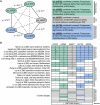
Detection of coexisting microbial lineages. (A) Schematic description of the analysis procedure. Publicly available 16S ribosomal RNA sequences are first grouped into operational taxonomic units (OTUs), then annotated according to unique environmental sampling events, and finally searched for statistically significant co-occurrences. Where available, completely sequenced genomes are mapped onto the resulting network, which is then clustered and annotated. (B) Example for a specific lineage association. The two lineages (defined at a 97% 16S sequence identity cutoff) have been sampled overall relatively rarely, but they occurred together three times, at three distinct sites. (or) Odds ratio. Under “Sampling sites,” the investigative work of “Baati H. et al., 2009” refers to R Amdouni, E Ammar, H Baati, N Gharsallah, and A Sghir (unpubl.).
Figure 2.
Global network of coexisting microbial lineages. (A) Overview of the network of lineage associations. Each node denotes a microbial lineage, and each line a significant co-occurrence relationship. Node size is proportional to the number of sequences in the lineage, and node color indicates the connectivity degree of a node (along a color gradient: blue, low connectivity; red, high connectivity). Throughout the figure, the OTU definition cutoff is at 97% sequence identity, and the _P_-value cutoff for an association is 0.001 (i.e., FDR after correction for multiple testing). (B) Connectivity degree distribution plot for the network in A. The distribution is coarsely compatible with a power law distribution. (C) Same network as in A, but partitioned using unsupervised Markov clustering, to reveal modules (clusters) of co-occurring lineages. Here, node color denotes taxonomic classification at the phylum level. Lineages suspected to contain potential laboratory contaminants (Tanner et al. 1998; Barton et al. 2006) are mainly observed in small clusters, and are marked with a small black X (17 such lineages in total).
Figure 3.
Example of a novel, previously undescribed module of coexisting lineages. (A) Five distinct microbial lineages are shown; they belong to three different phyla and are defined at an OTU-clustering distance of 90% sequence identity at the 16S rRNA gene. The five lineages have been exclusively observed through environmentally sampled sequences and have not been named. (B) The table shows all occurrence counts of these lineages among our sampling data; the _P_-values indicated have been corrected for multiple testing, against the background of all lineages defined at 90%. Adjusted _P_-values (FDR; p) and odds ratios (or) are indicated. (*) The samples by Li et al.(2008) have been collected at distinct sites, covering a distance of more than 600 miles; collection was at different water depths and sampling dates. Investigators involved in unpublished work are as follows: E Julies, V Bruechert, and BM Fuchs; B Orcutt, SB Joye, S Kleindienst, K Knittel, A Ramette, A Rietz, V Samarkin, T Treude, and A Boetius; A Postec, R Warthmann, C Vaconcelos, K Hanselmann, and J McKenzie; Z Zhang, H Xiao, and X Tang.
Figure 4.
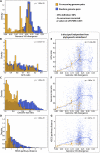
Coexisting lineages display similarities in genomic features. Here, we exclusively focus on co-occurring lineages for which completely sequenced genomes could be mapped to both partners (this genome mapping is globally visualized in Supplemental Fig. S6). Properties of such co-occurring genomes are compared, and contrasted against randomly paired genomes. (A) The distribution of 16S sequence divergence scores; shifted to the left for co-occurring genome pairs (i.e. they tend to be related phylogenetically). In panels E, F, and G, we test for independence between phylogenetic relatedness, and observations as shown in panels B, C, and D, respectively. Here, each dot denotes a pairwise genome comparison, and lines correspond to running medians.
Figure 5.
Functional similarities among co-occurring genomes. Each dot denotes a pair of genomes, which are either co-occurring in the environment (red to orange dots) or randomly paired (blue dots). The plot shows differences in functional genome content (_y_-axis), and in genome size (_x_-axis). Lines denote running medians. Note that, in general, the more divergent two genomes are in size, the more they are functionally distinct (blue line). In co-occurring genomes, this trend is strongly shifted toward similar functions, at all levels of phylogenetic relatedness (color-coded from red to orange). Examples of genome pairs that are discussed in the text are indicated.
Similar articles
- Genome composition and phylogeny of microbes predict their co-occurrence in the environment.
Kamneva OK. Kamneva OK. PLoS Comput Biol. 2017 Feb 2;13(2):e1005366. doi: 10.1371/journal.pcbi.1005366. eCollection 2017 Feb. PLoS Comput Biol. 2017. PMID: 28152007 Free PMC article. - Parallel Evolution of Genome Streamlining and Cellular Bioenergetics across the Marine Radiation of a Bacterial Phylum.
Getz EW, Tithi SS, Zhang L, Aylward FO. Getz EW, et al. mBio. 2018 Sep 18;9(5):e01089-18. doi: 10.1128/mBio.01089-18. mBio. 2018. PMID: 30228235 Free PMC article. - Interactions between closely related bacterial strains are revealed by deep transcriptome sequencing.
González-Torres P, Pryszcz LP, Santos F, Martínez-García M, Gabaldón T, Antón J. González-Torres P, et al. Appl Environ Microbiol. 2015 Dec;81(24):8445-56. doi: 10.1128/AEM.02690-15. Epub 2015 Oct 2. Appl Environ Microbiol. 2015. PMID: 26431969 Free PMC article. - Decoding molecular interactions in microbial communities.
Abreu NA, Taga ME. Abreu NA, et al. FEMS Microbiol Rev. 2016 Sep;40(5):648-63. doi: 10.1093/femsre/fuw019. Epub 2016 Jul 13. FEMS Microbiol Rev. 2016. PMID: 27417261 Free PMC article. Review. - Microbial Ecology and Genomics: A Crossroads of Opportunity: This report is based on a colloquium sponsored by the American Academy of Microbiology held February 23-25, 2001, in Singer Island, Florida.
[No authors listed] [No authors listed] Washington (DC): American Society for Microbiology; 2002. Washington (DC): American Society for Microbiology; 2002. PMID: 33119230 Free Books & Documents. Review.
Cited by
- Metagenomics and Bioinformatics in Microbial Ecology: Current Status and Beyond.
Hiraoka S, Yang CC, Iwasaki W. Hiraoka S, et al. Microbes Environ. 2016 Sep 29;31(3):204-12. doi: 10.1264/jsme2.ME16024. Epub 2016 Jul 5. Microbes Environ. 2016. PMID: 27383682 Free PMC article. Review. - Microbial interactions: from networks to models.
Faust K, Raes J. Faust K, et al. Nat Rev Microbiol. 2012 Jul 16;10(8):538-50. doi: 10.1038/nrmicro2832. Nat Rev Microbiol. 2012. PMID: 22796884 Review. - Pyrosequencing characterization of the microbiota from Atlantic intertidal marine sponges reveals high microbial diversity and the lack of co-occurrence patterns.
Alex A, Antunes A. Alex A, et al. PLoS One. 2015 May 20;10(5):e0127455. doi: 10.1371/journal.pone.0127455. eCollection 2015. PLoS One. 2015. PMID: 25992625 Free PMC article. - Impact of Geographical Location on the Gut Microbiota Profile in Egyptian Children with Type 1 Diabetes Mellitus: A Pilot Study.
Elsherbiny NM, Ramadan M, Abu Faddan NH, Hassan EA, Ali ME, Abd El-Rehim ASE, Abbas WA, Abozaid MAA, Hassanin E, Mohamed GA, Hetta HF, Salah M. Elsherbiny NM, et al. Int J Gen Med. 2022 Jul 15;15:6173-6187. doi: 10.2147/IJGM.S361169. eCollection 2022. Int J Gen Med. 2022. PMID: 35864993 Free PMC article. - Salinity-triggered homogeneous selection constrains the microbial function and stability in lakes.
Wang L, Lian C, Wan W, Qiu Z, Luo X, Huang Q, Deng Y, Zhang T, Yu K. Wang L, et al. Appl Microbiol Biotechnol. 2023 Nov;107(21):6591-6605. doi: 10.1007/s00253-023-12696-w. Epub 2023 Sep 9. Appl Microbiol Biotechnol. 2023. PMID: 37688597
References
- Alonso C, Warnecke F, Amann R, Pernthaler J 2007. High local and global diversity of Flavobacteria in marine plankton. Environ Microbiol 9: 1253–1266 - PubMed
- Angly FE, Willner D, Prieto-Davo A, Edwards RA, Schmieder R, Vega-Thurber R, Antonopoulos DA, Barott K, Cottrell MT, Desnues C, et al. 2009. The GAAS metagenomic tool and its estimations of viral and microbial average genome size in four major biomes. PLoS Comput Biol 5: e1000593 doi: 10.1371/journal.pcbi.1000593 - PMC - PubMed
- Baati H, Guermazi S, Amdouni R, Gharsallah N, Sghir A, Ammar E 2008. Prokaryotic diversity of a Tunisian multipond solar saltern. Extremophiles 12: 505–518 - PubMed
- Barabasi AL, Oltvai ZN 2004. Network biology: Understanding the cell's functional organization. Nat Rev Genet 5: 101–113 - PubMed
Publication types
MeSH terms
Substances
LinkOut - more resources
Full Text Sources
Other Literature Sources


