The trans-Saharan slave trade - clues from interpolation analyses and high-resolution characterization of mitochondrial DNA lineages - PubMed (original) (raw)
The trans-Saharan slave trade - clues from interpolation analyses and high-resolution characterization of mitochondrial DNA lineages
Nourdin Harich et al. BMC Evol Biol. 2010.
Abstract
Background: A proportion of 1/4 to 1/2 of North African female pool is made of typical sub-Saharan lineages, in higher frequencies as geographic proximity to sub-Saharan Africa increases. The Sahara was a strong geographical barrier against gene flow, at least since 5,000 years ago, when desertification affected a larger region, but the Arab trans-Saharan slave trade could have facilitate enormously this migration of lineages. Till now, the genetic consequences of these forced trans-Saharan movements of people have not been ascertained.
Results: The distribution of the main L haplogroups in North Africa clearly reflects the known trans-Saharan slave routes: West is dominated by L1b, L2b, L2c, L2d, L3b and L3d; the Center by L3e and some L3f and L3w; the East by L0a, L3h, L3i, L3x and, in common with the Center, L3f and L3w; while, L2a is almost everywhere. Ages for the haplogroups observed in both sides of the Saharan desert testify the recent origin (holocenic) of these haplogroups in sub-Saharan Africa, claiming a recent introduction in North Africa, further strengthened by the no detection of local expansions.
Conclusions: The interpolation analyses and complete sequencing of present mtDNA sub-Saharan lineages observed in North Africa support the genetic impact of recent trans-Saharan migrations, namely the slave trade initiated by the Arab conquest of North Africa in the seventh century. Sub-Saharan people did not leave traces in the North African maternal gene pool for the time of its settlement, some 40,000 years ago.
Figures
Figure 1
Routes for trans-Saharan slave trade. Adapted from Segal (2002) and Lovejoy (1983).
Figure 2
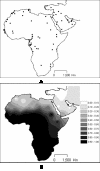
Map showing location of the population samples (A) used in this work and interpolation map for the L lineages in those samples (B).
Figure 3
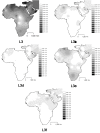
Interpolation maps for L0 haplogroup in the sub-Saharan pool observed in each sample.
Figure 4
Interpolation maps for L1 haplogroup in the sub-Saharan pool observed in each sample.
Figure 5
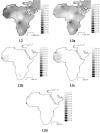
Interpolation maps for L2 haplogroup in the sub-Saharan pool observed in each sample.
Figure 6
Interpolation maps for L3 total, L3b, L3d, L3e and L3f haplogroups in the sub-Saharan pool observed in each sample.
Figure 7
Interpolation maps for L3h, L3i, L3x and L3w haplogroups in the sub-Saharan pool observed in each sample.
Figure 8
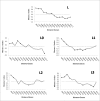
Spatial correlograms of Moran's I indeces for the total L frequency in the populations, and for the L0, L1, L2 and L3 proportions of the sub-Saharan pools in the samples. Geographic distances separating samples are distributed into 14 classes. Full dots represent significant p-values (p < 0.05); empty dots are non-significant p-values.
Figure 9
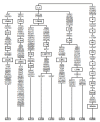
Phylogeny of the complete L3 sequences from El Jadida. Integers represent transitions when the suffixes "A", "G", "C" or "T" are appended and transversions when the suffixes "a", "g", "c" or "t" are appended. Deletions are indicated by a "d" following the deleted nucleotide position. Underlined nucleotide positions appear more than once in the tree.
Similar articles
- Ancient local evolution of African mtDNA haplogroups in Tunisian Berber populations.
Frigi S, Cherni L, Fadhlaoui-Zid K, Benammar-Elgaaied A. Frigi S, et al. Hum Biol. 2010 Aug;82(4):367-84. doi: 10.3378/027.082.0402. Hum Biol. 2010. PMID: 21082907 - The genomic analysis of current-day North African populations reveals the existence of trans-Saharan migrations with different origins and dates.
Lucas-Sánchez M, Fadhlaoui-Zid K, Comas D. Lucas-Sánchez M, et al. Hum Genet. 2023 Feb;142(2):305-320. doi: 10.1007/s00439-022-02503-3. Epub 2022 Nov 28. Hum Genet. 2023. PMID: 36441222 Free PMC article. - Mitochondrial DNA diversity in the African American population.
Johnson DC, Shrestha S, Wiener HW, Makowsky R, Kurundkar A, Wilson CM, Aissani B. Johnson DC, et al. Mitochondrial DNA. 2015 Jun;26(3):445-51. doi: 10.3109/19401736.2013.840591. Epub 2013 Oct 9. Mitochondrial DNA. 2015. PMID: 24102597 Free PMC article. - African human mtDNA phylogeography at-a-glance.
Rosa A, Brehem A. Rosa A, et al. J Anthropol Sci. 2011;89:25-58. doi: 10.4436/jass.89006. Epub 2011 Mar 15. J Anthropol Sci. 2011. PMID: 21368343 Review. - A population genetics perspective of the Indus Valley through uniparentally-inherited markers.
McElreavey K, Quintana-Murci L. McElreavey K, et al. Ann Hum Biol. 2005 Mar-Apr;32(2):154-62. doi: 10.1080/03014460500076223. Ann Hum Biol. 2005. PMID: 16096211 Review.
Cited by
- North and East African mitochondrial genetic variation needs further characterization towards precision medicine.
Fähnrich A, Stephan I, Hirose M, Haarich F, Awadelkareem MA, Ibrahim S, Busch H, Wohlers I. Fähnrich A, et al. J Adv Res. 2023 Dec;54:59-76. doi: 10.1016/j.jare.2023.01.021. Epub 2023 Feb 2. J Adv Res. 2023. PMID: 36736695 Free PMC article. - The imprint of the Slave Trade in an African American population: mitochondrial DNA, Y chromosome and HTLV-1 analysis in the Noir Marron of French Guiana.
Brucato N, Cassar O, Tonasso L, Tortevoye P, Migot-Nabias F, Plancoulaine S, Guitard E, Larrouy G, Gessain A, Dugoujon JM. Brucato N, et al. BMC Evol Biol. 2010 Oct 19;10:314. doi: 10.1186/1471-2148-10-314. BMC Evol Biol. 2010. PMID: 20958967 Free PMC article. - The Impact of Recent Demography on Functional Genetic Variation in North African Human Groups.
Lucas-Sánchez M, Abdeli A, Bekada A, Calafell F, Benhassine T, Comas D. Lucas-Sánchez M, et al. Mol Biol Evol. 2024 Jan 3;41(1):msad283. doi: 10.1093/molbev/msad283. Mol Biol Evol. 2024. PMID: 38152862 Free PMC article. - New Insight into the human genetic diversity in North African populations by genotyping of SNPs in DRD3, CSMD1 and NRG1 genes.
Mestiri S, Boussetta S, Pakstis AJ, El Kamel S, Ben Ammar El Gaaied A, Kidd KK, Cherni L. Mestiri S, et al. Mol Genet Genomic Med. 2022 Mar;10(3):e1871. doi: 10.1002/mgg3.1871. Epub 2022 Feb 7. Mol Genet Genomic Med. 2022. PMID: 35128830 Free PMC article. - Early Holocenic and Historic mtDNA African Signatures in the Iberian Peninsula: The Andalusian Region as a Paradigm.
Hernández CL, Soares P, Dugoujon JM, Novelletto A, Rodríguez JN, Rito T, Oliveira M, Melhaoui M, Baali A, Pereira L, Calderón R. Hernández CL, et al. PLoS One. 2015 Oct 28;10(10):e0139784. doi: 10.1371/journal.pone.0139784. eCollection 2015. PLoS One. 2015. PMID: 26509580 Free PMC article.
References
- Behar DM, Metspalu E, Kivisild T, Achilli A, Hadid Y, Tzur S, Pereira L, Amorim A, Quintana-Murci L, Majamaa K, Herrnstadt C, Howell N, Balanovsky O, Kutuev I, Pshenichnov A, Gurwitz D, Bonne-Tamir B, Torroni A, Villems R, Skorecki K. The matrilineal ancestry of Ashkenazi Jewry: portrait of a recent founder event. Am J Hum Genet. 2006;78:487–497. doi: 10.1086/500307. - DOI - PMC - PubMed
- Behar DM, Metspalu E, Kivisild T, Rosset S, Tzur S, Hadid Y, Yudkovsky G, Rosengarten D, Pereira L, Amorim A, Kutuev I, Gurwitz D, Bonne-Tamir B, Villems R, Skorecki K. Counting the founders: the matrilineal genetic ancestry of the Jewish Diaspora. PLoS One. 2008;3:e2062. doi: 10.1371/journal.pone.0002062. - DOI - PMC - PubMed
Publication types
MeSH terms
Substances
LinkOut - more resources
Full Text Sources

