Networks inferred from biochemical data reveal profound differences in toll-like receptor and inflammatory signaling between normal and transformed hepatocytes - PubMed (original) (raw)
Networks inferred from biochemical data reveal profound differences in toll-like receptor and inflammatory signaling between normal and transformed hepatocytes
Leonidas G Alexopoulos et al. Mol Cell Proteomics. 2010 Sep.
Abstract
Systematic study of cell signaling networks increasingly involves high throughput proteomics, transcriptional profiling, and automated literature mining with the aim of assembling large scale interaction networks. In contrast, functional analysis of cell signaling usually focuses on a much smaller sets of proteins and eschews computation but focuses directly on cellular responses to environment and perturbation. We sought to combine these two traditions by collecting cell response measures on a reasonably large scale and then attempting to infer differences in network topology between two cell types. Human hepatocytes and hepatocellular carcinoma cell lines were exposed to inducers of inflammation, innate immunity, and proliferation in the presence and absence of small molecule drugs, and multiplex biochemical measurement was then performed on intra- and extracellular signaling molecules. We uncovered major differences between primary and transformed hepatocytes with respect to the engagement of toll-like receptor and NF-kappaB-dependent secretion of chemokines and cytokines that prime and attract immune cells. Overall, our results serve as a proof of principle for an approach to network analysis that is systematic, comparative, and biochemically focused. More specifically, our data support the hypothesis that hepatocellular carcinoma cells down-regulate normal inflammatory and immune responses to avoid immune editing.
Figures
Fig. 1.
Experimental approach. The outline of the experimental approach shows identities of ligand cues and their receptors, intracellular signals assayed using xMAP technology, seven small molecule kinase inhibitors, and 50 secreted cytokines whose levels constituted responses. See Table I and
supplemental Tables 2 and 3
for further details.
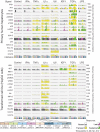
Fig. 2.
Signaling data set from human hepatocytes and HepG2 cells. Rows represent measures of 17 intracellular signals assayed at t = 0, 30 min, and 3 h (relative to ligand addition), and columns represent different ligand cues. For each combination of cue and signal, one of seven kinase inhibitors was applied as indicated in the schematic below the data. Data are coded to highlight no induction (relative to basal activity; gray), transient induction (peaking at 30 min; yellow), sustained induction (equal at 30 min and 3 h; green), or late induction (peaking at 3 h; purple). All data were processed using DataRail software (53). Cytokine data are show in
supplemental Fig. 1
. Hist., histone; PI3K, phosphatidylinositol 3-kinase.
Fig. 3.
One-step and two-step MLR illuminates widespread differences in common signal transduction pathways between hepatocytes and HepG2 cells. a, schematic of successive stages in MLR as applied to a subset of the data in Fig. 2_b_ (see “Experimental Procedures” and also
supplemental Fig. 3
for details). b and c, regression weights (vertical axes) for all cues, kinase inhibitors, and a subset of responses. Green bars depict cue-signal weights (b) and signal-response weights (c) derived from hepatocyte data, and red bars depict those from HepG2 cells. Background colors in each small rectangle code the combination of signal and cue as being more “hepatocyte-like” (green) or more “HepG2-like” (red) based on the relative regression weights; overall, the signals are ordered left to right based on this coding. For example, phosphohistone H3 (HistH3) levels on the extreme left are coded red and are much higher in HepG2 cells relative to hepatocytes, reflecting ongoing cell division in HepG2 cells. Inhibitor data are coded by extent of inhibition; the inhibition of many signals by the JNK inhibitor SP600125 probably reflects off-target effects (116) “_X_” denotes a measurement that is not meaningful because the cytokine was added exogenously as a cue. Hist., histone; PI3K, phosphatidylinositol 3-kinase; i, inhibitor.
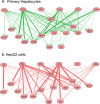
Fig. 4.
Node-edge graphs of signaling pathways reconstructed from data using multilinear regression. Directed node-edge graph of all cue-to-signal regression weights as visualized using the program Cytoscape (117) with receptors (for ligand cues) and signals as nodes. The thickness of each line is directly proportional to the corresponding regression weight. Green denotes primary hepatocytes, and red denotes HepG2 cells.
Fig. 5.
Reconstructed node-edge graphs drawn as pathways. Networks were reconstructed using the top 25% of regression weights from node-edge graphs (Fig. 4) and overlaid on a hand-drawn map of relevant pathways. Cue-to-signal regression weights derived from two-step MLR and signal-to-cytokine regression weights derived from one-step MLR are shown in upper panels (cue and signal effects). In lower panels (inhibitor effects), nodes representing inhibitors are positioned above their most proximal target that is also a measured variable (e.g. MEK inhibitor (MEKi) is positioned above ERK, p38 inhibitor is above phospho-Hsp27, etc.) with diameter proportional to the regression weight as obtained from the second step of two-step MLR. Dashed lines in lower panels denote activation, and solid lines denote inhibition. Note that the identities of targets for each drug are predefined (based on the literature), but the inhibition weight is obtained from the data.
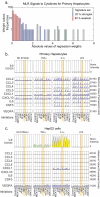
Fig. 6.
Hepatocytes, but not HepG2 cells, secrete a “signature set” of cytokines in response to inflammatory stimuli. a, distribution of regression weights in “signals to cytokine” MLR from hepatocyte data. The top 25% of weights (as depicted in Fig. 5, a and b) are shown in blue; the most significant weights, corresponding to signature set cytokines, are shown in green. Distributions for all other MLRs are shown in
supplemental Fig. 8
. b and c, levels of eight signature set cytokines in hepatocytes and HepG2 cells (as indicated) at t = 0, 3, and 24 h following exposure to TNFα, IL1α, or LPS. Phospho-IκB levels, a measure of IKK activity, are shown above the cytokine data with color coding as in Fig. 1. Absence of the signature set cytokine release in HepG2 cells following exposure to TNFα, IL1α, or LPS is shown by orange shading. VEGFA serves as a control. Norm., normalized; PI3K, phosphatidylinositol 3-kinase.
Fig. 7.
Signature cytokine secretion set is NF-κB-dependent. Secretion of the cytokine signature set in hepatocytes (at t = 24 h) is inhibited by three structurally distinct IKK inhibitors. Each subpanel depicts the level of a cytokine (as indicated at left) following exposure to three concentrations (400 n
m
, 2 μ
m
, and 10 μ
m
) of BMS-345541, IMD0345, or TPCA1 (as indicated above) in hepatocytes stimulated with TNFα, IL1α, or LPS (as indicated below). VEGFA serves as a negative control (gray background).
Fig. 8.
Validation of pathway comparisons. a and b, confirmation of relationships between phospho-p38 and phospho-Hsp27 levels in IL1α-treated hepatocytes and HepG2 cells. These correspond to the regression links denoted in Fig. 5 as white stars on a blue background. Phosphoprotein levels at seven time points (and t = 0) following treatment with IL1α alone (solid lines) or IL1α in combination with the IKK2 inhibitor BMS-345541 (BMS) (dashed line) were measured in hepatocytes and HepG2 cells. Following IL1α treatment, phospho-Hsp27 was stimulated to a greater extent in hepatocytes than in HepG2 cells even though p38 is more highly phosphorylated in HepG2 cells. Moreover, dephosphorylation of Hsp27 at t >3 h was BMS-345541-sensitive in hepatocytes but not HepG2 cells, confirming the primary MLR data and suggesting that in hepatocytes dephosphorylation of p38 and Hsp27 following IL1α treatment is IKK2-dependent, possibly via an IKK2-activated phosphatase (Phsp); w/o, without; A.U., absorbance units.
Fig. 9.
Release of signature set cytokines is profoundly impaired in HCC cells. Levels of signature set cytokines at t = 24 h following exposure of primary hepatocytes and four HCC cell lines to nine TLR agonists (see “Experimental Procedures” for details) are shown. Red bars denote induction of a cytokine significantly above background levels (shown in pink). Light blue background denotes cytokines that are inducibly secreted in hepatocytes but absent in HCC cell lines, whereas green background denotes a hepatocyte-like secretion.
Fig. 10.
NF-κB pathway remains functional in HCC cells. Nuclear translocation of NF-κB in IL1α-treated cells as assayed by immunofluorescence microscopy (right panels) is shown. Induction of phospho-IκB (Ser-32/Ser-36) levels in HCC cells and hepatocytes was determined following exposure to IL1α for 30 min.
Fig. 11.
Release of signature set cytokines remains NF-κB-dependent. Secretion of signature set cytokines at t = 24 h in four HCC cells in the presence and absence of IKK inhibitor BMS-345541 is shown. Data for primary hepatocytes (as indicated by the dashed box) are reproduced from Fig. 6 for sake of comparison. Each subpanel depicts the level of a cytokine (as indicated at left) in cells stimulated with TNFα, IL1α, or LPS (indicated below) and three BMS-345541 concentrations. Green background denotes inducible cytokine secretion, and blue denotes inhibition by BMS-345541. Gray denotes cytokine levels that were neither cue-inducible nor BMS-345541-inhibitable. The yellow bar graphs above show the integrated levels of all signature set cytokines for each stimulus in the absence of BMS-345541.
Similar articles
- Comparing signaling networks between normal and transformed hepatocytes using discrete logical models.
Saez-Rodriguez J, Alexopoulos LG, Zhang M, Morris MK, Lauffenburger DA, Sorger PK. Saez-Rodriguez J, et al. Cancer Res. 2011 Aug 15;71(16):5400-11. doi: 10.1158/0008-5472.CAN-10-4453. Epub 2011 Jul 8. Cancer Res. 2011. PMID: 21742771 Free PMC article. - Toll-like receptor stimulation in cardiomyoctes decreases contractility and initiates an NF-kappaB dependent inflammatory response.
Boyd JH, Mathur S, Wang Y, Bateman RM, Walley KR. Boyd JH, et al. Cardiovasc Res. 2006 Dec 1;72(3):384-93. doi: 10.1016/j.cardiores.2006.09.011. Epub 2006 Sep 23. Cardiovasc Res. 2006. PMID: 17054926 - TLR3 signaling in a hepatoma cell line is skewed towards apoptosis.
Khvalevsky E, Rivkin L, Rachmilewitz J, Galun E, Giladi H. Khvalevsky E, et al. J Cell Biochem. 2007 Apr 1;100(5):1301-12. doi: 10.1002/jcb.21119. J Cell Biochem. 2007. PMID: 17243100 - Innate and intrinsic antiviral immunity in skin.
Kawamura T, Ogawa Y, Aoki R, Shimada S. Kawamura T, et al. J Dermatol Sci. 2014 Sep;75(3):159-66. doi: 10.1016/j.jdermsci.2014.05.004. Epub 2014 Jun 2. J Dermatol Sci. 2014. PMID: 24928148 Review. - Cystic Fibrosis from Laboratory to Bedside: The Role of A20 in NF-κB-Mediated Inflammation.
Bannon A, Zhang SD, Schock BC, Ennis M. Bannon A, et al. Med Princ Pract. 2015;24(4):301-10. doi: 10.1159/000381423. Epub 2015 Apr 25. Med Princ Pract. 2015. PMID: 25925366 Free PMC article. Review.
Cited by
- Fibroblast mechanotransduction network predicts targets for mechano-adaptive infarct therapies.
Rogers JD, Richardson WJ. Rogers JD, et al. Elife. 2022 Feb 9;11:e62856. doi: 10.7554/eLife.62856. Elife. 2022. PMID: 35138248 Free PMC article. - Decoding the secreted inflammatory response of primary human hepatocytes to hypoxic stress in vitro.
Vodovotz Y, Simmons RL, Barclay D, Yin J, Jefferson BS, Zamora R. Vodovotz Y, et al. Ann Transl Med. 2019 Aug;7(16):371. doi: 10.21037/atm.2019.07.09. Ann Transl Med. 2019. PMID: 31555685 Free PMC article. - Network inference performance complexity: a consequence of topological, experimental and algorithmic determinants.
Muldoon JJ, Yu JS, Fassia MK, Bagheri N. Muldoon JJ, et al. Bioinformatics. 2019 Sep 15;35(18):3421-3432. doi: 10.1093/bioinformatics/btz105. Bioinformatics. 2019. PMID: 30932143 Free PMC article. - Interactions between Bacteriophage, Bacteria, and the Mammalian Immune System.
Van Belleghem JD, Dąbrowska K, Vaneechoutte M, Barr JJ, Bollyky PL. Van Belleghem JD, et al. Viruses. 2018 Dec 25;11(1):10. doi: 10.3390/v11010010. Viruses. 2018. PMID: 30585199 Free PMC article. Review. - Implementation of systems theory in liver cancer research.
Pinna F, Breuhahn K. Pinna F, et al. Hepat Oncol. 2015 Jan;2(1):9-11. doi: 10.2217/hep.14.29. Epub 2015 Jan 12. Hepat Oncol. 2015. PMID: 30190981 Free PMC article. No abstract available.
References
- Pieroni E., de la Fuente van Bentem S., Mancosu G., Capobianco E., Hirt H., de la Fuente A. (2008) Protein networking: insights into global functional organization of proteomes. Proteomics 8, 799–816 - PubMed
- Joughin B. A., Cheung E., Karuturi R., Saez-Rodriguez J., Lauffenburger D. A., Liu E. T. (2009) Cellular signaling networks, in Systems Biomedicine: Concepts and Perspective (Liu T., Lauffenburger D. A. eds) Academic Press; New York
- Cusick M. E., Klitgord N., Vidal M., Hill D. E. (2005) Interactome: gateway into systems biology. Hum. Mol. Genet. 14, R171–R181 - PubMed
- Russell R. B., Aloy P. (2008) Targeting and tinkering with interaction networks. Nat. Chem. Biol. 4, 666–673 - PubMed
- Rual J. F., Venkatesan K., Hao T., Hirozane-Kishikawa T., Dricot A., Li N., Berriz G. F., Gibbons F. D., Dreze M., Ayivi-Guedehoussou N., Klitgord N., Simon C., Boxem M., Milstein S., Rosenberg J., Goldberg D. S., Zhang L. V., Wong S. L., Franklin G., Li S., Albala J. S., Lim J., Fraughton C., Llamosas E., Cevik S., Bex C., Lamesch P., Sikorski R. S., Vandenhaute J., Zoghbi H. Y., Smolyar A., Bosak S., Sequerra R., Doucette-Stamm L., Cusick M. E., Hill D. E., Roth F. P., Vidal M. (2005) Towards a proteome-scale map of the human protein-protein interaction network. Nature 437, 1173–1178 - PubMed
Publication types
MeSH terms
Substances
LinkOut - more resources
Full Text Sources


