A presenilin-1 mutation identified in familial Alzheimer disease with cotton wool plaques causes a nearly complete loss of gamma-secretase activity - PubMed (original) (raw)
A presenilin-1 mutation identified in familial Alzheimer disease with cotton wool plaques causes a nearly complete loss of gamma-secretase activity
Elizabeth A Heilig et al. J Biol Chem. 2010.
Abstract
Mutations in presenilin-1 and presenilin-2 (PS1 and PS2) are the most common cause of familial Alzheimer disease. PS1 and PS2 are the presumptive catalytic components of the multisubunit gamma-secretase complex, which proteolyzes a number of type I transmembrane proteins, including the amyloid precursor protein (APP) and Notch. APP processing by gamma-secretase produces beta-amyloid peptides (Abeta40 and Abeta42) that accumulate in the Alzheimer disease brain. Here we identify a pathogenic L435F mutation in PS1 in two affected siblings with early-onset familial Alzheimer disease characterized by deposition of cerebral cotton wool plaques. The L435F mutation resides in a conserved C-terminal PAL sequence implicated in active site conformation and catalytic activity. The impact of PS1 mutations in and around the PAL motif on gamma-secretase activity was assessed by expression of mutant PS1 in mouse embryo fibroblasts lacking endogenous PS1 and PS2. Surprisingly, the L435F mutation caused a nearly complete loss of gamma-secretase activity, including >90% reductions in the generation of Abeta40, Abeta42, and the APP and Notch intracellular domains. Two nonpathogenic PS1 mutations, P433L and L435R, caused essentially complete loss of gamma-secretase activity, whereas two previously identified pathogenic PS1 mutations, P436Q and P436S, caused partial loss of function with substantial reductions in production of Abeta40, Abeta42, and the APP and Notch intracellular domains. These results argue against overproduction of Abeta42 as an essential property of presenilin proteins bearing pathogenic mutations. Rather, our findings provide support for the hypothesis that pathogenic mutations cause a general loss of presenilin function.
Figures
FIGURE 1.
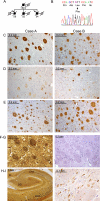
Identification of an L435F mutation in PS1 in familial Alzheimer disease with cotton wool plaques. A, the pedigree of a family with early-onset AD is shown. Arrows indicate probands, filled symbols indicate affected individuals, and numbers below symbols indicate age at death. Circles, female; squares, male; diagonal slash, deceased. B, sequence analysis of PS1 exons revealed heterozygosity for a C to T transition resulting in substitution of phenylalanine for leucine at amino acid 435. C–E, detection of Aβ in frontal cortex of both probands. C, detection of Aβ42 with C-terminal specific antibody revealed numerous CWPs that were strongly immunoreactive for Aβ42. D, diffuse staining of CWPs with Aβ40-specific antibody is shown. Occasional plaques displayed a dense core of Aβ40. E, detection of total Aβ revealed numerous CWPs, with a staining pattern similar to that for Aβ42. F–H, analysis of the hippocampus (Case A) revealed numerous large CWPs throughout CA1-CA3 regions, visible by silver staining (F and H) and hematoxylin-eosin (G). I, phospho-Tau-positive neurofibrillary tangles were abundant in CA1-CA3 and dentate gyrus (DG) regions. FI, fimbria; CA, cornu ammonis.
FIGURE 2.
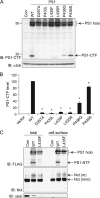
The PS1 L435F mutant displays deficient endoproteolysis but normal cell surface expression. Wild-type (WT) and mutant PS1 were transiently expressed in _PS_-null MEFs to assess endoproteolytic activity and cell surface localization. Con (A, C) and vector (B) indicate transfection with empty rather than PS1-expressing vector. A, detection of full-length PS1 and PS1-CTF by Western analysis is shown. Proteins were detected with antibodies recognizing the C terminus of PS1 (top panel) and α-tubulin (α-tub, lower panel). Arrows indicate PS1 holoprotein (holo) and CTF. IB, immunoblot. B, quantification of PS1-CTF production is shown. PS1-CTF levels were normalized to α-tubulin and expressed as % of WT levels. Data are the means of three independent experiments (*, p < 0.05 compared with WT PS1-CTF level; n = 3). C, PS1-L435F is delivered to the cell surface and rescues cell-surface localization of mature Nicastrin. PS1-WT and PS1-L435F bearing N-terminal FLAG epitope tags were transiently expressed in _PS_-null MEFs, and cell surface proteins were isolated by biotinylation and affinity precipitation. PS1and Nicastrin (Nct) were detected by Western analysis of total cell lysates and biotinylated cell surface fractions. The cytosolic protein α-tubulin served as a control for non-cell surface protein. Arrows indicate PS1 holoprotein (holo), PS1 N-terminal fragment (NTF), and immature (imm) and mature (m) forms of Nicastrin.
FIGURE 3.
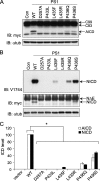
PS1 L435F and neighboring mutations markedly impair γ- secretase-dependent proteolytic cleavage of APP and Notch. To assess cleavage activity, WT and mutant PS1 were co-expressed with APP C99-myc or NotchΔE-myc by transient transfection in PS_-null MEFs, and full-length and cleaved substrates were detected by Western analysis. Con (A, B) and vector (C) indicate transfection with empty rather than PS1-expressing vector. Representative expression of PS1 for the same series of experiments is shown in Fig. 2_A. A, APP C99 and AICD were detected with antibody recognizing the myc epitope tag (*, nonspecific background band). IB, immunoblot; α-tub, α-tubulin. B, γ-secretase-dependent Notch cleavage was detected by Western analysis with antibody recognizing cleaved Notch ICD (top panel). Full-length NotchΔE and NICD were detected with anti-myc antibody (middle panel). C, quantification of AICD and NICD production by PS1 mutants is shown. AICD and NICD levels were normalized to α-tubulin and expressed as % of WT levels. Data are the means of three independent experiments (*, p < 0.05 versus AICD or NICD level in cells expressing WT PS1; n = 3). ICD, intracellular domain.
FIGURE 4.
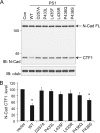
PS1 L435F and neighboring mutations inhibit γ-secretase-dependent cleavage of endogenous N-cadherin. WT and mutant PS1 were transiently expressed in _PS_-null MEFs. Disappearance of N-cadherin (N-Cad) CTF1 was monitored as a measure of γ-secretase activity toward endogenous substrate. Con (A) and vector (B) indicate transfection with empty rather than PS1-expressing vector. A, endogenous levels of full-length (FL) N-Cad and CTF1 were detected with antibody recognizing a sequence in the intracellular domain. IB, immunoblot; α-tub, α-tubulin. Con, control. B, quantification of N-Cad CTF1 levels is shown. CTF1 levels were normalized to α-tubulin and expressed as % of control (empty vector) levels. Data are the means of three independent experiments (*, p < 0.05 compared with transfection with empty vector; n = 3).
FIGURE 5.
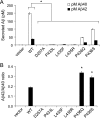
PS1 L435F and neighboring mutations cause marked reductions in the generation of both Aβ40 and Aβ42. WT and mutant PS1 were co-expressed with APP C99-myc by transient transfection in PS_-null MEFs, and the levels of secreted Aβ40 and Aβ42 were quantified by ELISA. Vector indicates transfection with empty rather than PS1-expressing vector. Representative expression of PS1 and APP C99 for the same series of experiments is shown in Figs. 2_A and 3_A. A_, Aβ levels (p
m
) in conditioned medium were measured by sandwich ELISA with antibodies specific for Aβ40 and Aβ42. The levels of Aβ40 and Aβ42 were at or below the threshold of detection for D257A, P433L, L435F, and L435R mutations. B, the concentration ratio of Aβ42/Aβ40 was calculated for mutations producing detectable levels of both cleavage products. Although total amounts of Aβ were significantly reduced for all mutations, the P436Q and P436S mutations resulted in an elevated Aβ42/Aβ40 ratio because of a greater reduction in Aβ40 than in Aβ42. Data shown are means of three separately transfected replicates and are a representative example from three independent experiments (A, *, p < 0.05 versus Aβ40 or Aβ42 levels, respectively, in cells transfected with WT PS1; B, *, p < 0.05 versus Aβ42/40 ratio for WT PS1; n = 3).
Similar articles
- Suppressor Mutations for Presenilin 1 Familial Alzheimer Disease Mutants Modulate γ-Secretase Activities.
Futai E, Osawa S, Cai T, Fujisawa T, Ishiura S, Tomita T. Futai E, et al. J Biol Chem. 2016 Jan 1;291(1):435-46. doi: 10.1074/jbc.M114.629287. Epub 2015 Nov 11. J Biol Chem. 2016. PMID: 26559975 Free PMC article. - Conformational Models of APP Processing by Gamma Secretase Based on Analysis of Pathogenic Mutations.
Kim M, Bezprozvanny I. Kim M, et al. Int J Mol Sci. 2021 Dec 18;22(24):13600. doi: 10.3390/ijms222413600. Int J Mol Sci. 2021. PMID: 34948396 Free PMC article. - Presenilin clinical mutations can affect gamma-secretase activity by different mechanisms.
Bentahir M, Nyabi O, Verhamme J, Tolia A, Horré K, Wiltfang J, Esselmann H, De Strooper B. Bentahir M, et al. J Neurochem. 2006 Feb;96(3):732-42. doi: 10.1111/j.1471-4159.2005.03578.x. Epub 2006 Jan 9. J Neurochem. 2006. PMID: 16405513 - Genes and mechanisms involved in beta-amyloid generation and Alzheimer's disease.
Steiner H, Capell A, Leimer U, Haass C. Steiner H, et al. Eur Arch Psychiatry Clin Neurosci. 1999;249(6):266-70. doi: 10.1007/s004060050098. Eur Arch Psychiatry Clin Neurosci. 1999. PMID: 10653281 Review. - Role of presenilin in gamma-secretase cleavage of amyloid precursor protein.
Xia W. Xia W. Exp Gerontol. 2000 Jul;35(4):453-60. doi: 10.1016/s0531-5565(00)00111-x. Exp Gerontol. 2000. PMID: 10959033 Review.
Cited by
- Cortical neurodegeneration caused by Psen1 mutations is independent of Aβ.
Yan K, Zhang C, Kang J, Montenegro P, Shen J. Yan K, et al. Proc Natl Acad Sci U S A. 2024 Aug 20;121(34):e2409343121. doi: 10.1073/pnas.2409343121. Epub 2024 Aug 13. Proc Natl Acad Sci U S A. 2024. PMID: 39136994 Free PMC article. - Loss of Presenilin 2 Function Is Associated with Defective LPS-Mediated Innate Immune Responsiveness.
Agrawal V, Sawhney N, Hickey E, McCarthy JV. Agrawal V, et al. Mol Neurobiol. 2016 Jul;53(5):3428-3438. doi: 10.1007/s12035-015-9285-0. Epub 2015 Jun 18. Mol Neurobiol. 2016. PMID: 26081153 - Loss of Aβ43 Production Caused by Presenilin-1 Mutations in the Knockin Mouse Brain.
Xia D, Kelleher RJ 3rd, Shen J. Xia D, et al. Neuron. 2016 Apr 20;90(2):417-22. doi: 10.1016/j.neuron.2016.03.009. Neuron. 2016. PMID: 27100200 Free PMC article. - Synaptic function of nicastrin in hippocampal neurons.
Lee SH, Sharma M, Südhof TC, Shen J. Lee SH, et al. Proc Natl Acad Sci U S A. 2014 Jun 17;111(24):8973-8. doi: 10.1073/pnas.1408554111. Epub 2014 Jun 2. Proc Natl Acad Sci U S A. 2014. PMID: 24889619 Free PMC article. - Deletion of the γ-secretase subunits Aph1B/C impairs memory and worsens the deficits of knock-in mice modeling the Alzheimer-like familial Danish dementia.
Biundo F, Ishiwari K, Del Prete D, D'Adamio L. Biundo F, et al. Oncotarget. 2016 Mar 15;7(11):11923-44. doi: 10.18632/oncotarget.7389. Oncotarget. 2016. PMID: 26942869 Free PMC article.
References
- Tandon A., Rogaeva E., Mullan M., St George-Hyslop P. H. (2000) Curr. Opin. Neurol. 13, 377–384 - PubMed
- Bertram L., Tanzi R. E. (2008) Nat. Rev. Neurosci. 9, 768–778 - PubMed
- Brunkan A. L., Goate A. M. (2005) J. Neurochem. 93, 769–792 - PubMed
- Selkoe D. J., Wolfe M. S. (2007) Cell 131, 215–221 - PubMed
Publication types
MeSH terms
Substances
Grants and funding
- R01 NS041783/NS/NINDS NIH HHS/United States
- R01 NS075346/NS/NINDS NIH HHS/United States
- R01 NS41783/NS/NINDS NIH HHS/United States
- T32 AG000222-18/AG/NIA NIH HHS/United States
LinkOut - more resources
Full Text Sources
Medical
Molecular Biology Databases
