Spectral responses of the human circadian system depend on the irradiance and duration of exposure to light - PubMed (original) (raw)
Spectral responses of the human circadian system depend on the irradiance and duration of exposure to light
Joshua J Gooley et al. Sci Transl Med. 2010.
Abstract
In humans, modulation of circadian rhythms by light is thought to be mediated primarily by melanopsin-containing retinal ganglion cells, not rods or cones. Melanopsin cells are intrinsically blue light-sensitive but also receive input from visual photoreceptors. We therefore tested in humans whether cone photoreceptors contribute to the regulation of circadian and neuroendocrine light responses. Dose-response curves for melatonin suppression and circadian phase resetting were constructed in subjects exposed to blue (460 nm) or green (555 nm) light near the onset of nocturnal melatonin secretion. At the beginning of the intervention, 555-nm light was equally effective as 460-nm light at suppressing melatonin, suggesting a significant contribution from the three-cone visual system (lambda(max) = 555 nm). During the light exposure, however, the spectral sensitivity to 555-nm light decayed exponentially relative to 460-nm light. For phase-resetting responses, the effects of exposure to low-irradiance 555-nm light were too large relative to 460-nm light to be explained solely by the activation of melanopsin. Our findings suggest that cone photoreceptors contribute substantially to nonvisual responses at the beginning of a light exposure and at low irradiances, whereas melanopsin appears to be the primary circadian photopigment in response to long-duration light exposure and at high irradiances. These results suggest that light therapy for sleep disorders and other indications might be optimized by stimulating both photoreceptor systems.
Figures
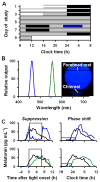
Fig. 1
Protocol for assessing melatonin suppression and phase-shift responses. (A) Subjects participated in a 9-day inpatient protocol. White bars indicate exposure to ambient room light (<190 lux) and gray bars indicate exposure to dim ambient light (<3 lux). Black bars show scheduled sleep episodes in darkness (<0.002 lux), and the blue bar indicates the 6.5-h light intervention. (B) On the evening of day 6, each subject was exposed to 6.5 h of 460 nm or 555 nm light. The blue and green traces show the relative spectral content for a pair of representative light exposures to 460 nm and 555 nm light, respectively. The inset shows a frontal view of the modified Ganzfeld dome used to administer the light exposure. (C) Melatonin suppression and phase-shift responses are shown for two representative subjects exposed to 460 nm light (top traces), or 555 nm light (bottom traces) at 12.85 log photons cm−2 s−1. In each plot, black traces show melatonin on the day before the light exposure. In the left column, colored traces show melatonin suppression during the 6.5-h light exposure with open boxes marking the timing of the light intervention. In the right column, colored traces show the melatonin rhythm on the day after the light exposure, and drop lines indicate the timing of the dim light melatonin onset (clock time at which melatonin level exceeds 25% of the peak-to-trough fitted amplitude).
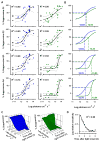
Fig. 2
Melatonin suppression sensitivity to 460 nm light versus 555 nm light exposure. (A) Dose-response curves for melatonin suppression are shown in response to 460 nm light (left, blue circles) and 555 nm light (right, green circles) in quarterly intervals (Q1–Q4, top-to-bottom) across the 6.5-h light exposure. Closed and open circles show suppression of plasma or salivary melatonin, respectively, in individual subjects. Black traces show the best-fit dose-response curve with 95% confidence intervals. Black filled circles at 0 log irradiance show melatonin suppression in response to darkness. (B) The dose-response curves are overlaid, demonstrating a short-wavelength shift in spectral sensitivity during the light exposure. Horizontal dashed lines indicate the half-maximal melatonin suppression response, and vertical dashed lines show the corresponding log ED50 values which are labeled in each plot. (C) The dose-response for melatonin suppression to 460 nm light (left) remained relatively constant during the light exposure, whereas the dose-response to 555 light (right) exhibited a slow reduction in sensitivity across time (half-life = 37.85 min). (D) With increasing duration of light, the sensitivity of melatonin suppression to 555 nm light decayed exponentially relative to 460 nm light exposure. All data were analyzed in hourly bins and were plotted by midpoint of the binned data. The dashed trace at the lower asymptote (−0.88 log units) corresponds to the predicted difference in log-relative sensitivity at these wavelengths for a photoreceptor with peak sensitivity to 481 nm light.
Fig. 3
Circadian phase shifts in response to retinal exposure to 460 nm versus 555 nm light. (A) Dose-response curves for circadian phase resetting are shown in response to 6.5-h of 460 nm light (left, blue circles) versus 555 nm light (right, green circles) exposure. Closed and open circles show phase shifts of plasma or salivary melatonin, respectively, in individual subjects. Black traces show the best-fit dose-response curve with 95% confidence intervals. Black filled circles at 0 log irradiance show phase shifts in response to darkness. (B) The dose-response curves are overlaid, demonstrating a difference in relative spectral sensitivity across irradiance levels. The horizontal dashed line indicates the half-maximal phase-shift response, and vertical dashed lines show the corresponding log ED50 values, which are indicated on the plot. (C) Phase shifts in response to 555 nm light exposure did not match the best-fit univariant dose-response template (black dashed trace). (D) At low irradiances (<13 log photons cm−2 s−1; ~24 lux for 555 nm and ~2 lux for 460 nm light), phase-resetting responses to 555 nm light exposure were larger than predicted for a response mediated by melanopsin. Phase-shift residuals are shown relative to the predicted melanopsin-driven response, indicated by the dotted line. The predicted ‘melanopsin-only’ response to 555 nm light exposure was derived by translating the dose-response curve to 460 nm light by the predicted difference in log-relative sensitivity at these wavelengths for a photopigment with peak sensitivity to 480 nm light. For each group, the mean is shown with 95% confidence intervals.
References
- Czeisler CA, Shanahan TL, Klerman EB, Martens H, Brotman DJ, Emens JS, Klein T, Rizzo JF., III Suppression of melatonin secretion in some blind patients by exposure to bright light. N Engl J Med. 1995;332:6–11. - PubMed
- Klerman EB, Shanahan TL, Brotman DJ, Rimmer DW, Emens JS, Rizzo JF, III, Czeisler CA. Photic resetting of the human circadian pacemaker in the absence of conscious vision. J Biol Rhythms. 2002;17:548–555. - PubMed
- Ruberg FL, Skene DJ, Hanifin JP, Rollag MD, English J, Arendt J, Brainard GC. Melatonin regulation in humans with color vision deficiencies. J Clin Endocrinol Metab. 1996;81:2980–2985. - PubMed
- Zaidi FH, Hull JT, Peirson SN, Wulff K, Aeschbach D, Gooley JJ, Brainard GC, Gregory-Evans K, Rizzo JF, III, Czeisler CA, Foster RG, Moseley MJ, Lockley SW. Short-wavelength light sensitivity of circadian, pupillary, and visual awareness in humans lacking an outer retina. Curr Biol. 2007;17:2122–2128. - PMC - PubMed
Publication types
MeSH terms
Substances
Grants and funding
- MH45130/MH/NIMH NIH HHS/United States
- AT002129/AT/NCCIH NIH HHS/United States
- NS36590/NS/NINDS NIH HHS/United States
- R01 NS036590/NS/NINDS NIH HHS/United States
- R01 MH045130/MH/NIMH NIH HHS/United States
- R01 AT002129/AT/NCCIH NIH HHS/United States
- T32 HL007901/HL/NHLBI NIH HHS/United States
- T32-HL07901/HL/NHLBI NIH HHS/United States
- M01 RR002635/RR/NCRR NIH HHS/United States
- M01 RR02635/RR/NCRR NIH HHS/United States
LinkOut - more resources
Full Text Sources
Other Literature Sources


