Pleiotropic role for MYCN in medulloblastoma - PubMed (original) (raw)
. 2010 May 15;24(10):1059-72.
doi: 10.1101/gad.1907510.
Matthew R Grimmer, Christopher S Hackett, Paul A Northcott, Qi-Wen Fan, David D Goldenberg, Jasmine Lau, Selma Masic, Kim Nguyen, Slava Yakovenko, Xiao-Ning Zhe, Heather C Flynn Gilmer, Rodney Collins, Mai Nagaoka, Joanna J Phillips, Robert B Jenkins, Tarik Tihan, Scott R Vandenberg, C David James, Kohichi Tanaka, Michael D Taylor, William A Weiss, Louis Chesler
Affiliations
- PMID: 20478998
- PMCID: PMC2867210
- DOI: 10.1101/gad.1907510
Pleiotropic role for MYCN in medulloblastoma
Fredrik J Swartling et al. Genes Dev. 2010.
Abstract
Medulloblastoma (MB) is the most common malignant brain tumor of childhood. Sonic Hedgehog (SHH) signaling drives a minority of MB, correlating with desmoplastic pathology and favorable outcome. The majority, however, arises independently of SHH and displays classic or large cell anaplastic (LCA) pathology and poor prognosis. To identify common signaling abnormalities, we profiled mRNA, demonstrating misexpression of MYCN in the majority of human MB and negligible expression in normal cerebella. We clarified a role in pathogenesis by targeting MYCN (and luciferase) to cerebella of transgenic mice. MYCN-driven MB showed either classic or LCA pathologies, with Shh signaling activated in approximately 5% of tumors, demonstrating that MYCN can drive MB independently of Shh. MB arose at high penetrance, consistent with a role for MYCN in initiation. Tumor burden correlated with bioluminescence, with rare metastatic spread to the leptomeninges, suggesting roles for MYCN in both progression and metastasis. Transient pharmacological down-regulation of MYCN led to both clearance and senescence of tumor cells, and improved survival. Targeted expression of MYCN thus contributes to initiation, progression, and maintenance of MB, suggesting a central role for MYCN in pathogenesis.
Figures
Figure 1.
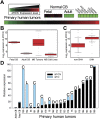
Aberrant expression of MYCN is prominent in human MB. (A) Expression analysis of 103 primary MB tumors (MB Tumors), nine normal fetal cerebella (Fetal CB), five normal adult cerebella (Adult CB), and seven MB cell lines (MB Cell Lines) for MYCN obtained using Affymetrix exon arrays. MYCN was expressed in all normal fetal cerebella and in >90% of primary tumors, but not in normal adult cerebella or in tumor-derived cell lines. (B,C) Results of A in box plot form and quantified for SHH-driven versus SHH-independent tumors. (Center line) Median; (red boxes) upper and lower quartiles; (bars) range of nonoutliers; (circles outside the boxes) outliers. (D) Quantitative real-time PCR analysis in a subset of 20 primary human MB tumors (selected randomly) using normal cerebella as controls. Expression of MYCN was observed in the vast majority of tumors, irrespective of pathology. The highest levels of MYC expression were in tumors with low MYCN expression. (C) Classic; (L) LCA; (D) desmoplastic.
Figure 2.
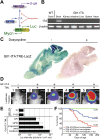
Targeting expression of MYCN to the hindbrain gives rise to MB. (A) Expression of tTA protein driven by the murine Glt1 promoter. In the absence of dox, tTA protein drives expression from a promoter element, the TRE. Glt1-tTA mice were mated to mice carrying either TRE-LacZ or TML transgenes. (B) RT–PCR analysis of organs indicated from P14 Glt1-tTA mice showed brain-specific expression of tTA with undetectable levels of tTA mRNA in kidney, intestine, liver, spleen, and heart. (C) Glt1-tTA:TRE-LacZ mice show strong β-gal staining in the brain, especially cerebellum. Mice fed dox chow at P60 showed absence of LacZ activity. (D, panels 1–5) Luc imaging allows robust detection of tumors in Glt1-tTA:TRE-MYCN/Luc (GTML) mice. A single, representative GTML mouse is depicted in panels 2–5. (E) Quantification of luminescence intensities. In GTML P7 mice (GP7), signals from the hindbrain (before tumors arise) were more than two logs greater than the background levels observed in Glt1-tTA mice (P7). At 30 d (GP30), 75 d (progressing tumor), and 100 d (moribund) after birth, progression in GTML mice was evidenced over approximately three logs of dynamic range before sacrifice due to tumor burden. (F) Survival data for GTML mice demonstrate a transgene dose effect. Tumors arising in mice homozygous for TML (doubling the MYCN copy number, red line) showed shortened latency and increased penetrance relative to hemizygous mice (blue line). GTML mice treated with dox from P1 to P30 (green line) survived until sacrifice at P200.
Figure 3.
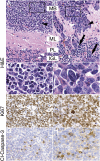
GTML tumors represent two distinct, aggressive MB histologies. (A) Tumor cells of classic histology (black arrowhead) were similar in size to mature granule cells in the IGL (white arrowhead). (B) When compared with classic tumors, LCA tumors exhibited increased nuclear-to-cytoplasmic ratios (black arrowhead), polygonal cell morphology (white arrowhead), and high levels of anaplasia. Invasion was prominent in LCA tumors, with disruption of molecular layer, Purkinje layer, and IGL (ML, PL, and IGL respectively; black arrows). (C) Inset from A shows detail of small, round, blue cells of the classic histology. (D) Inset from B shows detail of large, angular, pleiomorphic LCA cells. (E,F) Immunohistochemical staining for the proliferative marker Ki67 shows strong staining in both classic and LCA GTML tumors, suggesting aggressive tumor growth. (G,H) Immunohistochemical staining for the marker of apoptosis, cleaved Caspase-3 (Cl-Caspase-3), shows positive staining in both classic and LCA GTML tumors, respectively. All pictures except inset (1000×) are shown at 400× magnification.
Figure 4.
GTML tumors require sustained expression of MYCN. (A) Administration of dox chow for a week (D0–D7) to GTML mice with established tumors decreased Luc signal intensity to near background levels in two representative mice. (B) Quantified luminescence demonstrated a three-log decrease in cerebellar Luc signal intensity after 7 d on dox. (C) Western blot analysis of GTML tumors treated with dox for 7 d shows reduced levels of Mycn protein and cyclin D1. A representative untreated GTML tumor shows moderate apoptosis by cleaved Caspase-3 staining (D) and no senescent cells, as shown by senescence-associated β-galactosidase (SA-β-gal) staining (E). (F,G) Acute dox treatment after i.p. injections of dox (6h Dox) leads to a reduction of apoptotic cells but an increase of senescent cells, as indicated. (H,I) A representative GTML mouse after 7 d of dox (7d Dox) shows no apoptosis but several senescent cells, respectively. (J,K) A mouse with a large tumor treated for 30 d with dox and for 80 d without dox (30d Dox + 80d) presents no apoptotic cells and a few scattered senescent cells in tumor remains, respectively. Shown in 400× magnification.
Figure 5.
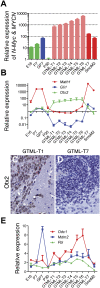
Expression analysis of GTML tumors generally describing a classic MB profile. (A) Expression analysis by qRT–PCR detecting both N-Myc (endogenous murine promoter) and transgene level (MYCN) in seven GTML tumors (GTML-T1–7), one Math1–SmoM2 tumor (SmoM2), and controls of cerebella from normal (E16, P7, and P30) and GTML (GP7) mice. Normal controls are presented in green bars, GP7 is shown in blue, Shh− tumors (GTML-T1-6) are indicated in light red, and Shh+ tumors (GTML-T7 and SmoM2) are presented in dark red. (B) Expression analysis by qRT–PCR for markers of Shh activation (Gli1), granule cell precursor lineage (Math1), and nondesmoplastic MB (Otx2). (C,D). IHC showing elevated Otx2 protein expression in the GTML-T1 tumor, but no (or low) expression in the GTML–T7 tumor, respectively (400× magnification). (E) Up-regulated expression of N-Myc-target genes Odc1, Mdm2, and Fbl (>1) in almost all tumors generally correlating with levels of MYCN. The expression levels are all relative to expression of total RNA prepared from normal adult (P60) cerebellum, and data are representative of two experiments performed in triplicate and normalized to Gapdh.
Figure 6.
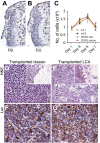
EGL cell proliferation is normal in GTML mice, and GTML tumors are transplantable. The width of the EGL in the cerebellum of a P7 wild-type (wt) mouse (A) is not different from the EGL in a P7 GTML mouse (B). EGL cells are visualized here with hematoxylin (blue), and non-EGL cells are stained with Sox9 (brown) that is positive in ependymal and glial cells. Choroid plexus is cut away to the right of the pictures. (C) Fluorescence from an EGL cell proliferation assay (CyQUANT) showing the calculated cell number (per 96 wells) at days 1, 3, 5, and 7 after representative outgrowth from two wild-type control mice, one GTML hemizygous mouse, and one GTML doubly homozygous mouse (from quadruplicate measures). (D,E) Classic and LCA GTML tumors retain their classic and LCA histopathology (stained with H&E) after transplantation, respectively. Inset shows tumors (darker) on the right in brain of hosts. (F,G) Tumors are positive for transgenic Luc, as shown using an antibody directed against the Luc protein, in respective samples. All pictures except inset (40×) are shown at 400× magnification.
Figure 7.
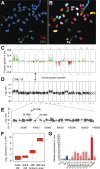
Genomic instability and Shh independence in GTML tumors. (A) Spectral karyotyping (SKY) and FISH in metaphase of a doubly hemizygous GTML mouse. The red arrow indicates hybridization of the TML probe (red) on chromosome 5. The green arrow indicates hybridization of the Glt1-tTA probe (Glt1; green) on chromosome 3. (B) Chromosomes shown in SKY display colors with chromosomes 3 and 5 indicated (the color scheme for all chromosomes is presented in Supplemental Fig. 6A). (C) Frequency plot of genomic changes in GTML tumors by array CGH. Tumors showed gains at chromosomes 1 and 11q and losses at chromosome 13 (syntenic with human chromosomes 6, 17q, and 1q, respectively), three sites frequently altered in human poor-risk MB. (D,E) CGH analysis for one tumor, GTML-T8, showed a subchromosomal amplification (36.7 Mb) on mouse chromosome 5. (F) Box plots showing human LYAR expression levels in MB samples and controls (as described in Fig. 1). (G) Expression analysis by qRT–PCR detecting the candidate gene Lyar in mice using previous set of controls in green and blue (see Fig. 5A). All GTML tumors (except GTML-T8 in dark red) are now presented in light-red bars.
Similar articles
- Biological and clinical heterogeneity of MYCN-amplified medulloblastoma.
Korshunov A, Remke M, Kool M, Hielscher T, Northcott PA, Williamson D, Pfaff E, Witt H, Jones DT, Ryzhova M, Cho YJ, Wittmann A, Benner A, Weiss WA, von Deimling A, Scheurlen W, Kulozik AE, Clifford SC, Peter Collins V, Westermann F, Taylor MD, Lichter P, Pfister SM. Korshunov A, et al. Acta Neuropathol. 2012 Apr;123(4):515-27. doi: 10.1007/s00401-011-0918-8. Epub 2011 Dec 9. Acta Neuropathol. 2012. PMID: 22160402 - MYC family amplification and clinical risk-factors interact to predict an extremely poor prognosis in childhood medulloblastoma.
Ryan SL, Schwalbe EC, Cole M, Lu Y, Lusher ME, Megahed H, O'Toole K, Nicholson SL, Bognar L, Garami M, Hauser P, Korshunov A, Pfister SM, Williamson D, Taylor RE, Ellison DW, Bailey S, Clifford SC. Ryan SL, et al. Acta Neuropathol. 2012 Apr;123(4):501-13. doi: 10.1007/s00401-011-0923-y. Epub 2011 Dec 3. Acta Neuropathol. 2012. PMID: 22139329 - LOXL1-AS1 contributes to metastasis in sonic-hedgehog medulloblastoma by promoting cancer stem-like phenotypes.
Do AD, Wu KS, Chu SS, Giang LH, Lin YL, Chang CC, Wong TT, Hsieh CL, Sung SY. Do AD, et al. J Exp Clin Cancer Res. 2024 Apr 30;43(1):130. doi: 10.1186/s13046-024-03057-0. J Exp Clin Cancer Res. 2024. PMID: 38689348 Free PMC article. - Childhood tumors of the nervous system as disorders of normal development.
Grimmer MR, Weiss WA. Grimmer MR, et al. Curr Opin Pediatr. 2006 Dec;18(6):634-8. doi: 10.1097/MOP.0b013e32801080fe. Curr Opin Pediatr. 2006. PMID: 17099362 Review. - The MYCN oncoprotein as a drug development target.
Lu X, Pearson A, Lunec J. Lu X, et al. Cancer Lett. 2003 Jul 18;197(1-2):125-30. doi: 10.1016/s0304-3835(03)00096-x. Cancer Lett. 2003. PMID: 12880971 Review.
Cited by
- The role of stem cells and progenitors in the genesis of medulloblastoma.
Wang J, Wechsler-Reya RJ. Wang J, et al. Exp Neurol. 2014 Oct;260:69-73. doi: 10.1016/j.expneurol.2012.11.014. Epub 2012 Nov 22. Exp Neurol. 2014. PMID: 23178582 Free PMC article. Review. - Downregulation of MYCN through PI3K Inhibition in Mouse Models of Pediatric Neural Cancer.
Cage TA, Chanthery Y, Chesler L, Grimmer M, Knight Z, Shokat K, Weiss WA, Gustafson WC. Cage TA, et al. Front Oncol. 2015 May 12;5:111. doi: 10.3389/fonc.2015.00111. eCollection 2015. Front Oncol. 2015. PMID: 26029667 Free PMC article. - Medulloblastoma development: tumor biology informs treatment decisions.
Gopalakrishnan V, Tao RH, Dobson T, Brugmann W, Khatua S. Gopalakrishnan V, et al. CNS Oncol. 2015;4(2):79-89. doi: 10.2217/cns.14.58. CNS Oncol. 2015. PMID: 25768332 Free PMC article. Review. - MYCN drives chemoresistance in small cell lung cancer while USP7 inhibition can restore chemosensitivity.
Grunblatt E, Wu N, Zhang H, Liu X, Norton JP, Ohol Y, Leger P, Hiatt JB, Eastwood EC, Thomas R, Ibrahim AH, Jia D, Basom R, Eaton KD, Martins R, Houghton AM, MacPherson D. Grunblatt E, et al. Genes Dev. 2020 Sep 1;34(17-18):1210-1226. doi: 10.1101/gad.340133.120. Epub 2020 Aug 20. Genes Dev. 2020. PMID: 32820040 Free PMC article. - BarTeL, a Genetically Versatile, Bioluminescent and Granule Neuron Precursor-Targeted Mouse Model for Medulloblastoma.
Shackleford GM, Shi XH, Swanson KS, Mahdi MY, Gonzalez-Gomez I, Asgharzadeh S, D'Apuzzo M, Erdreich-Epstein A, Moats RA. Shackleford GM, et al. PLoS One. 2016 Jun 16;11(6):e0156907. doi: 10.1371/journal.pone.0156907. eCollection 2016. PLoS One. 2016. PMID: 27310018 Free PMC article.
References
- Adesina AM, Nalbantoglu J, Cavenee WK 1994. p53 gene mutation and mdm2 gene amplification are uncommon in medulloblastoma. Cancer Res 54: 5649–5651 - PubMed
- Aldosari N, Bigner SH, Burger PC, Becker L, Kepner JL, Friedman HS, McLendon RE 2002. MYCC and MYCN oncogene amplification in medulloblastoma. A fluorescence in situ hybridization study on paraffin sections from the Children's Oncology Group. Arch Pathol Lab Med 126: 540–544 - PubMed
- Ben-Arie N, Bellen HJ, Armstrong DL, McCall AE, Gordadze PR, Guo Q, Matzuk MM, Zoghbi HY 1997. Math1 is essential for genesis of cerebellar granule neurons. Nature 390: 169–172 - PubMed
- Brodeur GM, Seeger RC, Schwab M, Varmus HE, Bishop JM 1984. Amplification of N-myc in untreated human neuroblastomas correlates with advanced disease stage. Science 224: 1121–1124 - PubMed
Publication types
MeSH terms
Substances
LinkOut - more resources
Full Text Sources
Other Literature Sources
Molecular Biology Databases
Research Materials
Miscellaneous
