Quantitative proteomics combined with BAC TransgeneOmics reveals in vivo protein interactions - PubMed (original) (raw)
Quantitative proteomics combined with BAC TransgeneOmics reveals in vivo protein interactions
Nina C Hubner et al. J Cell Biol. 2010.
Abstract
Protein interactions are involved in all cellular processes. Their efficient and reliable characterization is therefore essential for understanding biological mechanisms. In this study, we show that combining bacterial artificial chromosome (BAC) TransgeneOmics with quantitative interaction proteomics, which we call quantitative BAC-green fluorescent protein interactomics (QUBIC), allows specific and highly sensitive detection of interactions using rapid, generic, and quantitative procedures with minimal material. We applied this approach to identify known and novel components of well-studied complexes such as the anaphase-promoting complex. Furthermore, we demonstrate second generation interaction proteomics by incorporating directed mutational transgene modification and drug perturbation into QUBIC. These methods identified domain/isoform-specific interactors of pericentrin- and phosphorylation-specific interactors of TACC3, which are necessary for its recruitment to mitotic spindles. The scalability, simplicity, cost effectiveness, and sensitivity of this method provide a basis for its general use in small-scale experiments and in mapping the human protein interactome.
Figures
Figure 1.
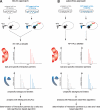
QUBIC: a method for mapping protein–protein interactions by combination of BAC TransgeneOmics and quantitative MS. (A and B) Two optimized AP-MS approaches of QUBIC are shown using either SILAC (A) or label-free (B) protein quantitation. (A) In SILAC experiments, the WT cell line without a BAC transgene is cultured in a medium containing the C12N14 form of lysine, and the tagged cell line is cultured in a medium containing the C13N15 form of lysine. Separate pull-downs using magnetic beads coupled to anti-GFP antibody are performed, and elutes merged directly after elution by in-column digestion. Peptides are identified by high resolution LC-MS/MS and quantified by directly comparing relative intensities of the light and heavy forms of each peptide present in the mass spectrum. Specific interaction partners show high H/L ratios, whereas background binders have a ratio of 1. (B) In label-free experiments, tagged and control cells are cultured in normal media, and separate pull-downs are performed. Eluates are not mixed but analyzed separately by LC-MS/MS. Proteins are quantified with the label-free algorithm in MaxQuant software.
Figure 2.
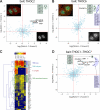
SILAC pull-downs of the TREX core components. (A and B) Results of THOC2 (A) and THOC6 (B) analysis are shown. The GFP-tagged protein, serving as bait, is indicated in the title. Annotated proteins marked by a black dot were more abundant in the pull-down of the tagged cell line, with P < 0.01 in both the forward and reverse experiments. Blue dots represent proteins that were not significant interaction partners. (top left) Fluorescence microscopy was performed on fixed samples of the indicated cell line with anti-GFP antibodies (green), α-tubulin antibodies (red), and DAPI (blue). (bottom right) Anti-GFP staining only is shown. (C) Two-way hierarchical clustering of specific TREX interactors. Proteins with a ratio >2 and P < 0.1 in the forward and reverse experiments of one of the pull-downs served as dataset for clustering (vertical direction). The color code represents the multiplied ratios of the forward and multiplied inverted ratios of the reverse experiment in log scale. Blue indicates proteins with a ratio <1 or no ratio, and red indicates proteins with extremely high ratios. The first cluster represents the TREX complex, and adaptor proteins are separated from the core by the tree. The T complex clusters are shown below the TREX. Furthermore, several proteins binding to all TREX components, but with a lower ratio (yellow), have been identified (TREX-associated proteins). Proteins identified with very low ratios in only one of the IPs (bottom of clustering) are likely to be contaminants. (D) Pull-downs of all forward and reverse experiments have been treated as a single experiment, and forward were plotted against reverse experiments. TREX core and T complex are clear outliers as well as all TREX adaptors identified by the clustering. DDX39, a known interactor of the TREX complex, also shows a significant ratio in the combined analysis (
Fig. S1
). Bars, 10 µm.
Figure 3.
SILAC and label-free pull-downs of CDC23. (A) SILAC pull-down of CDC23 versus the untagged HeLa cell line. Annotated proteins were specific interaction partners of CDC23 with a p-value of ratio significance <0.001. APC core proteins are separated from APC adaptors (CDC20 and FZR1) by intensity. (B) Volcano plot representing results of the label-free pull-down of CDC23. The logarithmic ratio of protein intensities in the CDC23/HeLa pull-downs were plotted against negative logarithmic p-values of the t test performed from triplicates. A hyperbolic curve separates specific CDC23-interacting proteins marked in black (red dotted line) from background (blue dots). The known components of the APC (C10orf104/ANAPC16 only recently characterized in parallel studies), several known APC adaptors, and one uncharacterized protein, C11orf51, show a significant ratio in combination with high reproducibility (positive log2 ratios). (C) Localization patterns of GFP-tagged CDC23 and the new component C11orf51 in interphase. Bars, 10 µm.
Figure 4.
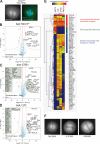
Label-free pull-downs of TACC3 and TACC3 interaction partners. (A) Live imaging of cells expressing GFP-tagged TACC3 and mCherry-tagged α-tubulin. DNA was stained with Hoechst. The RNAi-resistant TACC3WT localizes to the spindles in mitosis after RNAi of endogenous TACC3. (left) Chromosome alignment and spindle morphology are shown. (right) The fluorescence signal of GFP-tagged TACC3 is shown. (B–D) Volcano plots representing results of the label-free pull-downs of GFP-tagged TACC3, CLTC, and GTSE1. The logarithmic ratios of protein intensities are plotted against negative logarithmic p-values of the t test performed from triplicates. The hyperbolic curve separates specifically interacting proteins marked in black (red dotted line) from background (blue dots). Names of all proteins specifically interacting are reported in
Table S1
. (E) Two-way hierarchical clustering of TACC3 and specific interactors CLTC, GTSE1, and PIK3C2A. Proteins significant binding in one of the pull-downs served as dataset for clustering (vertical direction). The color code represents the normalized log2 of ratios multiplied with the negative logarithmic p- values of the t test. Blue fields represent values close to 0, and the protein is therefore unlikely to be binding, whereas red fields represent highly specific binders in the distinct pull-down experiment. The first cluster represents a novel spindle-associated complex (red). The second cluster represents TACC3-specific interactors (green). The cluster marked in blue mainly consists of proteins associated with clathrin-coated vesicles. (F) Fluorescence microscopy showing live GFP fluorescence of TACC3, CLTC, and GTSE1 C-terminally tagged with GFP by the BAC TransgenOmics standard protocol. Both TACC3 interactors localize to the mitotic spindle. Bars, 10 µm.
Figure 5.
Label-free pull-downs of TACC3 untreated and treated with aurora A inhibitor. (A and B) Live imaging of cells expressing GFP-tagged TACC3 and mCherry-tagged α-tubulin. DNA was stained with Hoechst. (top) Chromosome alignment and spindle morphology are shown. (bottom) The fluorescence signal of GFP-tagged TACC3 is shown. (A) TACC3WT normally localizes to spindles in untreated cells (left) but is mislocalized away from spindles after treatment with the aurora A kinase inhibitor MLN8054, similar to TACC3AAA (middle and right). Under both MLN8054-treated and mutant TACC3 conditions, spindle morphology and chromosome alignment are compromised. (B) The RNAi-resistant TACC3AAA mutant does not localize to spindles after RNAi of endogenous TACC3 (middle and right). (C) Volcano plot representing differential binding partners of TACC3 in dependence of treatment with aurora A kinase inhibitor. The logarithmic ratios of protein intensities are plotted against negative logarithmic p-values of the t test performed from triplicates. Proteins binding specifically in either condition are marked in black and annotated. (D) Localization of TACC3 after RNAi of phospho-dependent interactors. Cells expressing TACC3WT and mCherry–α-tubulin were transfected with control (CON), CLTC, or GTSE1 siRNAs, and live cells were imaged after 72 h. TACC3 is mislocalized from spindles after CLTC but not GTSE1 RNAi. Bars, 10 µm.
Figure 6.
Mitotic spindle localization interdependencies of CLTC, TACC3, and GTSE1 by RNAi and after aurora A inhibition. (A) Live imaging of mitotic cells expressing GFP-tagged CLTC, TACC3, or GTSE1 after RNAi (72 h). GTSE1 is mislocalized after CLTC or TACC3 RNAi, TACC3 is mislocalized after CLTC, but not GTSE1 RNAi, and CLTC is not mislocalized by either TACC3 or GTSE1 RNAi. Two images of representative cells are shown for each condition. (B) Live imaging of mitotic cells expressing GFP-tagged CLTC, TACC3, or GTSE1 after treatment with the aurora A kinase inhibitor MLN8054. Inhibition of aurora A activity mislocalizes GTSE1 but not CLTC from the mitotic spindle. Two images of representative cells are shown for each condition. CON, control. Bars, 10 µm.
Figure 7.
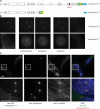
Fluorescence analysis of pericentrinlong and pericentrinshort cell lines. (A) Diagram of pericentrinlong and pericentrinshort BAC constructs. Pericentrinshort lacks a 29.5-kb region of genomic DNA present in pericentrinlong, including the PACT domain (red). The green and yellow box represents the GFP cassette. (B) Pericentrinlong and pericentrinshort show distinct cell cycle localizations. Still images from videos of GFP fluorescence are shown. (top) Pericentrinlong localizes to centrosomes throughout the cell cycle. (bottom) Pericentrinshort only shows centrosomal localization in mitosis. (C) Immunofluorescence showing pericentrinshort localization to centrosomes. Mitotic but not interphase centrosomes are stained by anti-GFP (pericentrinshort), whereas anti-pericentrin antibody labels all centrosomes. Arrows point to the location of interphase centrosomes. (bottom) Enlarged images of the above boxed regions are shown, containing two prophase/prometaphase centrosomes and one interphase centrosome. Cells are stained for α-tubulin, GFP (pericentrinshort), pericentrin, and DNA. Bars, 10 µm.
Figure 8.
Pull-downs of pericentrin splice isoforms. (A–C) Volcano plots representing results of the label-free pull-downs of GFP-tagged pericentrinshort and pericentrinlong. The logarithmic ratio of protein intensities in the pericentrin/HeLa (A and B) and pericentrinlong/pericentrinshort (C) pull-downs were plotted against negative logarithmic p-values of the t test performed from triplicates. (A and B) The hyperbolic curve separates specific pericentrin-interacting proteins marked in black (red dotted line) from background (blue dots). (C) Proteins binding specifically to either form of pericentrin are marked in black. The dotted line represents the ratio of pericentrinlong/pericentrinshort. (D) Plotted relative intensities of all peptides identified from pericentrinshort (blue) and pericentrinlong (red). The N-terminal part of the protein was identified in both pull-downs, whereas there is a stretch of ∼500 amino acids unique to the pericentrinshort form (green box). The C terminus was deleted in pericentrinshort, and therefore, peptides from this region were only identified in the pull-downs of pericentrinlong (brown box).
Similar articles
- BAC TransgeneOmics: a high-throughput method for exploration of protein function in mammals.
Poser I, Sarov M, Hutchins JR, Hériché JK, Toyoda Y, Pozniakovsky A, Weigl D, Nitzsche A, Hegemann B, Bird AW, Pelletier L, Kittler R, Hua S, Naumann R, Augsburg M, Sykora MM, Hofemeister H, Zhang Y, Nasmyth K, White KP, Dietzel S, Mechtler K, Durbin R, Stewart AF, Peters JM, Buchholz F, Hyman AA. Poser I, et al. Nat Methods. 2008 May;5(5):409-15. doi: 10.1038/nmeth.1199. Epub 2008 Apr 6. Nat Methods. 2008. PMID: 18391959 Free PMC article. - Extracting gene function from protein-protein interactions using Quantitative BAC InteraCtomics (QUBIC).
Hubner NC, Mann M. Hubner NC, et al. Methods. 2011 Apr;53(4):453-9. doi: 10.1016/j.ymeth.2010.12.016. Epub 2010 Dec 22. Methods. 2011. PMID: 21184827 - Recombineering BAC transgenes for protein tagging.
Ciotta G, Hofemeister H, Maresca M, Fu J, Sarov M, Anastassiadis K, Stewart AF. Ciotta G, et al. Methods. 2011 Feb;53(2):113-9. doi: 10.1016/j.ymeth.2010.09.003. Epub 2010 Sep 22. Methods. 2011. PMID: 20868752 Review. - A human interactome in three quantitative dimensions organized by stoichiometries and abundances.
Hein MY, Hubner NC, Poser I, Cox J, Nagaraj N, Toyoda Y, Gak IA, Weisswange I, Mansfeld J, Buchholz F, Hyman AA, Mann M. Hein MY, et al. Cell. 2015 Oct 22;163(3):712-23. doi: 10.1016/j.cell.2015.09.053. Epub 2015 Oct 22. Cell. 2015. PMID: 26496610 - TransgeneOmics--A transgenic platform for protein localization based function exploration.
Hasse S, Hyman AA, Sarov M. Hasse S, et al. Methods. 2016 Mar 1;96:69-74. doi: 10.1016/j.ymeth.2015.10.005. Epub 2015 Oct 17. Methods. 2016. PMID: 26475212 Review.
Cited by
- DNA repair. Proteomics reveals dynamic assembly of repair complexes during bypass of DNA cross-links.
Räschle M, Smeenk G, Hansen RK, Temu T, Oka Y, Hein MY, Nagaraj N, Long DT, Walter JC, Hofmann K, Storchova Z, Cox J, Bekker-Jensen S, Mailand N, Mann M. Räschle M, et al. Science. 2015 May 1;348(6234):1253671. doi: 10.1126/science.1253671. Epub 2015 Apr 30. Science. 2015. PMID: 25931565 Free PMC article. - The role of γ-tubulin in centrosomal microtubule organization.
O'Toole E, Greenan G, Lange KI, Srayko M, Müller-Reichert T. O'Toole E, et al. PLoS One. 2012;7(1):e29795. doi: 10.1371/journal.pone.0029795. Epub 2012 Jan 10. PLoS One. 2012. PMID: 22253783 Free PMC article. - Poxvirus Protein MC132 from Molluscum Contagiosum Virus Inhibits NF-B Activation by Targeting p65 for Degradation.
Brady G, Haas DA, Farrell PJ, Pichlmair A, Bowie AG. Brady G, et al. J Virol. 2015 Aug;89(16):8406-15. doi: 10.1128/JVI.00799-15. J Virol. 2015. PMID: 26041281 Free PMC article. - Ligand-based receptor identification on living cells and tissues using TRICEPS.
Frei AP, Moest H, Novy K, Wollscheid B. Frei AP, et al. Nat Protoc. 2013;8(7):1321-36. doi: 10.1038/nprot.2013.072. Epub 2013 Jun 13. Nat Protoc. 2013. PMID: 23764939 - Insight into the sulfur metabolism of Desulfurella amilsii by differential proteomics.
Florentino AP, Pereira IAC, Boeren S, van den Born M, Stams AJM, Sánchez-Andrea I. Florentino AP, et al. Environ Microbiol. 2019 Jan;21(1):209-225. doi: 10.1111/1462-2920.14442. Epub 2018 Nov 15. Environ Microbiol. 2019. PMID: 30307104 Free PMC article.
References
Publication types
MeSH terms
Substances
LinkOut - more resources
Full Text Sources
Other Literature Sources
Miscellaneous


