Differential activation of NK cells by influenza A pseudotype H5N1 and 1918 and 2009 pandemic H1N1 viruses - PubMed (original) (raw)
Differential activation of NK cells by influenza A pseudotype H5N1 and 1918 and 2009 pandemic H1N1 viruses
Ning Du et al. J Virol. 2010 Aug.
Abstract
Natural killer (NK) cells are the effectors of innate immunity and are recruited into the lung 48 h after influenza virus infection. Functional NK cell activation can be triggered by the interaction between viral hemagglutinin (HA) and natural cytotoxicity receptors NKp46 and NKp44 on the cell surface. Recently, novel subtypes of influenza viruses, such as H5N1 and 2009 pandemic H1N1, transmitted directly to the human population, with unusual mortality and morbidity rates. Here, the human NK cell responses to these viruses were studied. Differential activation of heterogeneous NK cells (upregulation of CD69 and CD107a and gamma interferon [IFN-gamma] production as well as downregulation of NKp46) was observed following interactions with H5N1, 1918 H1N1, and 2009 H1N1 pseudotyped particles (pps), respectively, and the responses of the CD56(dim) subset predominated. Much stronger NK activation was triggered by H5N1 and 1918 H1N1 pps than by 2009 H1N1 pps. The interaction of pps with NK cells and subsequent internalization were mediated by NKp46 partially. The NK cell activation by pps showed a dosage-dependent manner, while an increasing viral HA titer attenuated NK activation phenotypes, cytotoxicity, and IFN-gamma production. The various host innate immune responses to different influenza virus subtypes or HA titers may be associated with disease severity.
Figures
FIG. 1.
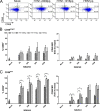
Expression of the early activation marker CD69 on NK cells in response to influenza virus pps. Freshly purified human NK cells from 18 different donors were cocultured overnight with H1N1-2009pps, H1N1-1918pps, or H5N1pps at doses ranging from 50 to 1,000 HAU/ml. (A) CD69 expression on mock-treated NK cells and on NK cells stimulated with pps at a dosage of 1,000 HAU/ml from one representative donor. FACS plots are gated on CD56+ CD3− lymphocytes. Percentages indicate the proportions of CD56bright or CD56dim cells that were positive for CD69. Data are based on the collection of 20,000 total events. (B) CD69 expression on CD56bright NK cells. The percentage of CD69+ cells (left) and the fold increase in CD69 median fluorescence intensity (MFI) (right) are shown. (C) CD69 expression on CD56dim NK cells. The percentage of CD69+ cells (left) and the fold increase in CD69 MFI (right) are shown. *, P < 0.05; **, P < 0.01.
FIG. 2.
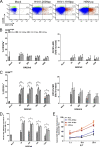
Expression of CD107a on NK cells in response to influenza virus pps and the cytotoxicity of NK cells toward K562 cells after stimulation by pps. Freshly purified human NK cells from 18 different donors were cocultured overnight with H1N1-2009pps, H1N1-1918pps, or H5N1pps at doses ranging from 50 to 1,000 HAU/ml. CD107a expression was assessed by intracellular staining followed by flow cytometric analysis. For the cytotoxicity assay, K562 cells were prestained with calcein AM, cocultured with pp-stimulated NK cells or mock-treated NK cells for 3 h, and then stained with ethidium homodimer-1. Cytotoxicity was analyzed by flow cytometry and calculated as the percentage of cells stained with calcein AM plus ethidium homodimer-1 cells among the total cells stained with calcein AM. (A) CD107a expression on mock-treated NK cells and on NK cells stimulated with pps at a dose of 1,000 HAU/ml from one representative donor. FACS plots are gated on CD56+ CD3− lymphocytes. Percentages indicate the proportions of CD56bright or CD56dim cells that were positive for CD107a. Data are based on the collection of 50,000 total events. (B) CD107a expression on CD56bright NK cells. The percentage of CD107a+ cells (left panel) and the fold increase in CD107a MFI (right panel) are shown. (C) CD107a expression on CD56dim NK cells. The percentage of CD107a+ cells (left) and the fold increase in CD107a MFI (right) are shown. (D) Cytotoxic activity of mock-treated and pp-stimulated NK cells from 6 individuals toward K562 cells at an E/T ratio of 20:1. (E) Cytotoxic activity of mock-treated NK cells and NK cells from 6 individuals stimulated by pps at a dose of 200 HAU/ml toward K562 cells at different E/T ratios. E/T ratio, ratio of effector to target cells; *, P < 0.05; **, P < 0.01.
FIG. 3.
Influenza virus pp-induced IFN-γ in NK cells. Freshly purified human NK cells from 18 different donors were cocultured overnight with H1N1-2009pps, H1N1-1918pps, or H5N1pps at doses ranging from 50 to 1,000 HAU/ml. IFN-γ was determined with cell-free supernatants using human IFN-γ Flex Set reagents (BD Biosciences) according to the manufacturer's protocol. Concentrations are shown in pg/ml. **, P < 0.01.
FIG. 4.
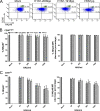
Expression of NKp46 on NK cells in response to influenza virus pps. Freshly purified human NK cells from 18 different donors were cocultured overnight with H1N1-2009pps, H1N1-1918pps, or H5N1pps at doses ranging from 50 to 1,000 HAU/ml. NKp46 expression was analyzed by surface staining and flow cytometric analysis. (A) NKp46 expression on mock-treated NK cells and on NK cells stimulated with pps at a dose of 1,000 HAU/ml from one representative donor. FACS plots are gated on CD56+ CD3− lymphocytes. Percentages indicate the proportions of CD56bright or CD56dim cells that were positive for NKp46. Data are based on the collection of 20,000 total events. (B) NKp46 expression on CD56bright NK cells. The percentage of NKp46+ cells (left) and the decrease percentage in NKp46 MFI (right) are shown. (C) NKp46 expression on CD56dim NK cells. The percentage of NKp46+ cells (left) and the decrease percentage in NKp46 MFI (right) are shown.
FIG. 5.
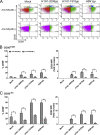
Enhanced NK cell activation partially induced by NKp46 downregulation. Freshly purified human NK cells from 6 different donors were first incubated for 1 h with or without unlabeled anti-NKp46 MAb at a concentration of 10 μg/ml and then cocultured overnight with H1N1-2009pps, H1N1-1918pps, or H5N1pps at a dose of 200 HAU/ml. Corresponding isotype antibody was added as control. (A) CD69 expression on mock-treated NK cells and on NK cells stimulated with pps from one representative donor. FACS plots are gated on CD56+ CD3− lymphocytes. Percentages indicate the proportions of CD56bright or CD56dim cells that were positive for CD69. Data are based on the collection of 50,000 total events. (B) CD69 expression on CD56bright NK cells. The percentage of CD69+ cells (left) and the fold increase in CD69 MFI (right) are shown. (C) CD69 expression on CD56dim NK cells. The percentage of CD69+ cells (left) and the fold increase in CD69 MFI (right) are shown. *, P < 0.05; **, P < 0.01.
Similar articles
- Influenza A Virus Hemagglutinin and Other Pathogen Glycoprotein Interactions with NK Cell Natural Cytotoxicity Receptors NKp46, NKp44, and NKp30.
Luczo JM, Ronzulli SL, Tompkins SM. Luczo JM, et al. Viruses. 2021 Jan 21;13(2):156. doi: 10.3390/v13020156. Viruses. 2021. PMID: 33494528 Free PMC article. Review. - Effect of influenza A infection on umbilical cord blood natural killer function regulation with interleukin-15.
Lin SJ, Cheng PJ, Lin TY, Lee PT, Hsiao HS, Kuo ML. Lin SJ, et al. J Infect Dis. 2012 Mar 1;205(5):745-56. doi: 10.1093/infdis/jir843. Epub 2012 Jan 18. J Infect Dis. 2012. PMID: 22262794 - Killing of avian and Swine influenza virus by natural killer cells.
Achdout H, Meningher T, Hirsh S, Glasner A, Bar-On Y, Gur C, Porgador A, Mendelson M, Mandelboim M, Mandelboim O. Achdout H, et al. J Virol. 2010 Apr;84(8):3993-4001. doi: 10.1128/JVI.02289-09. Epub 2010 Feb 3. J Virol. 2010. PMID: 20130050 Free PMC article. - Phenotypic and Functional Characteristics of a Novel Influenza Virus Hemagglutinin-Specific Memory NK Cell.
Zheng J, Wen L, Yen HL, Liu M, Liu Y, Teng O, Wu WF, Ni K, Lam KT, Huang C, Yang J, Lau YL, Perlman S, Peiris M, Tu W. Zheng J, et al. J Virol. 2021 May 24;95(12):e00165-21. doi: 10.1128/JVI.00165-21. Print 2021 May 24. J Virol. 2021. PMID: 33827945 Free PMC article. - [Inhibition of NK cytotoxic effect mediated by influenza A virus H1N1 and the insight into a new concept of therapeutic strategy].
Su L, Liu LH. Su L, et al. Bing Du Xue Bao. 2011 Jan;27(1):81-5. Bing Du Xue Bao. 2011. PMID: 21462512 Review. Chinese. No abstract available.
Cited by
- Decreased natural killer cell activity as a potential predictor of hypertensive incidence.
Lee YK, Suh E, Oh H, Haam JH, Kim YS. Lee YK, et al. Front Immunol. 2024 Apr 23;15:1376421. doi: 10.3389/fimmu.2024.1376421. eCollection 2024. Front Immunol. 2024. PMID: 38715619 Free PMC article. - NK cell subsets and dysfunction during viral infection: a new avenue for therapeutics?
Bjorgen JC, Dick JK, Cromarty R, Hart GT, Rhein J. Bjorgen JC, et al. Front Immunol. 2023 Oct 19;14:1267774. doi: 10.3389/fimmu.2023.1267774. eCollection 2023. Front Immunol. 2023. PMID: 37928543 Free PMC article. Review. - Influenza A Virus Hemagglutinin and Other Pathogen Glycoprotein Interactions with NK Cell Natural Cytotoxicity Receptors NKp46, NKp44, and NKp30.
Luczo JM, Ronzulli SL, Tompkins SM. Luczo JM, et al. Viruses. 2021 Jan 21;13(2):156. doi: 10.3390/v13020156. Viruses. 2021. PMID: 33494528 Free PMC article. Review. - Natural Killer Cells and Host Defense Against Human Rhinoviruses Is Partially Dependent on Type I IFN Signaling.
van der Heide SL, Xi Y, Upham JW. van der Heide SL, et al. Front Cell Infect Microbiol. 2020 Oct 21;10:510619. doi: 10.3389/fcimb.2020.510619. eCollection 2020. Front Cell Infect Microbiol. 2020. PMID: 33194777 Free PMC article.
References
- Alter, G., J. M. Malenfant, and M. Altfeld. 2004. CD107a as a functional marker for the identification of natural killer cell activity. J. Immunol. Methods 294:15-22. - PubMed
- Arnon, T. I., H. Achdout, N. Lieberman, R. Gazit, T. Gonen-Gross, G. Katz, A. Bar-Ilan, N. Bloushtain, M. Lev, A. Joseph, E. Kedar, A. Porgador, and O. Mandelboim. 2004. The mechanisms controlling the recognition of tumor- and virus-infected cells by NKp46. Blood 103:664-672. - PubMed
- Becker, I., N. Salaiza, and M. Aguirre. 2003. Leishmania lipophosphoglycan (LPG) activates NK cells through toll like receptor 2. Mol. Biochem. Parasitol. 130:65-74. - PubMed
- Biassoni, R. 1999. The murine homologue of the human NKp46, a triggering receptor involved in the induction of natural cytotoxicity. Eur. J. Immunol. 29:1014-1020. - PubMed
- Bottino, C., R. Biassoni, R. Millo, L. Moretta, and A. Moretta. 2000. The human natural cytotoxicity receptors (NCR) that induce HLA class I independent NK cell triggering. Hum. Immunol. 61:1-6. - PubMed
Publication types
MeSH terms
Substances
LinkOut - more resources
Full Text Sources
Other Literature Sources
Medical
Research Materials


