Tryptophan catabolism by indoleamine 2,3-dioxygenase 1 alters the balance of TH17 to regulatory T cells in HIV disease - PubMed (original) (raw)
. 2010 May 19;2(32):32ra36.
doi: 10.1126/scitranslmed.3000632.
Jeff Mold, Peter W Hunt, Bittoo Kanwar, P'ng Loke, Lillian Seu, Jason D Barbour, Margaret M Lowe, Anura Jayawardene, Francesca Aweeka, Yong Huang, Daniel C Douek, Jason M Brenchley, Jeffrey N Martin, Frederick M Hecht, Steven G Deeks, Joseph M McCune
Affiliations
- PMID: 20484731
- PMCID: PMC3034445
- DOI: 10.1126/scitranslmed.3000632
Tryptophan catabolism by indoleamine 2,3-dioxygenase 1 alters the balance of TH17 to regulatory T cells in HIV disease
David Favre et al. Sci Transl Med. 2010.
Abstract
The pathogenesis of human and simian immunodeficiency viruses is characterized by CD4(+) T cell depletion and chronic T cell activation, leading ultimately to AIDS. CD4(+) T helper (T(H)) cells provide protective immunity and immune regulation through different immune cell functional subsets, including T(H)1, T(H)2, T regulatory (T(reg)), and interleukin-17 (IL-17)-secreting T(H)17 cells. Because IL-17 can enhance host defenses against microbial agents, thus maintaining the integrity of the mucosal barrier, loss of T(H)17 cells may foster microbial translocation and sustained inflammation. Here, we study HIV-seropositive subjects and find that progressive disease is associated with the loss of T(H)17 cells and a reciprocal increase in the fraction of the immunosuppressive T(reg) cells both in peripheral blood and in rectosigmoid biopsies. The loss of T(H)17/T(reg) balance is associated with induction of indoleamine 2,3-dioxygenase 1 (IDO1) by myeloid antigen-presenting dendritic cells and with increased plasma concentration of microbial products. In vitro, the loss of T(H)17/T(reg) balance is mediated directly by the proximal tryptophan catabolite from IDO metabolism, 3-hydroxyanthranilic acid. We postulate that induction of IDO may represent a critical initiating event that results in inversion of the T(H)17/T(reg) balance and in the consequent maintenance of a chronic inflammatory state in progressive HIV disease.
Conflict of interest statement
Competing interests: The authors report no competing interests.
Figures
Fig. 1
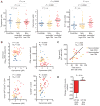
Tryptophan catabolism is elevated in HIV disease progression. Plasma samples were obtained from chronically HIV-infected subjects from the SCOPE Cohort, who were either viral controllers (n = 20) or noncontrollers with high or low CD4+ T cell counts (respectively, higher or lower than 350 cells/μl, n = 33 in each group) (for further details, see Materials and Methods, Patient populations, Study A, and table S1). (A) Plasma concentration of circulating tryptophan (left), kynurenine (middle), and K/T ratio (right). n.s., not significant. (B) Correlation of plasma kynurenine concentration with measures of HIV disease progression, including viral load, CD4+ T cell counts, as well as CD4+ and CD8+ T cell activation status, as measured by the fraction of cells positive for HLA-DR and CD38. The colors in these panels correspond to those in (A). (C) K/T ratio over time in noncontrollers with high or low CD4+ T cell counts (median, 7.8 months; IQR, 4.7 to 11.9 months). (D) Change of CD4+ T cell counts over time in viral noncontrollers with high CD4+ T cell counts (>500 cells/μl) and either high or low K/T ratios (respectively, higher or lower than 63.2, the median K/T ratio from all noncontrollers). The Mann-Whitney U test was used for group comparisons. The Spearman rank correlation test was used for correlations, with _R_s being the Spearman correlation coefficient.
Fig. 2
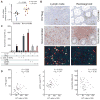
IDO is up-regulated in mDCs in tissues from HIV+ subjects and by IFN and LPS in vitro. (A) mRNA expression of IDO relative to that of β-actin in rectosigmoid biopsies from noncontrollers compared to controllers. (B) Top two rows: IDO expression by immunohistochemistry in lymph node (left panels) and in rectosigmoid biopsy tissues (right panels) of HIV-seronegative (HIV Neg) subjects or viral controllers compared to viral noncontrollers. Bottom row: Colocalization of IDO (green) and the mDC marker (DEC205) (red), visualized as cells that are yellow-orange in color (see arrows) in lymph node and rectosigmoid biopsy tissues. (C) IDO activity as measured by kynurenine concentration in the supernatant of monocyte-derived DCs after exposure to IFN-γ alone and in combination with LPS or other TLR ligands, as well as with inflammatory cytokines IL-17 or a mix of IL-1β, IL-6, and TNFα. Data are representative of that measured in two donors. (D) Correlation between K/T ratio and plasma concentrations of LPS (left), sCD14 (middle), and EndoCAb concentrations (right). The Mann-Whitney U test was used for group comparisons. The Spearman rank correlation test was used for correlations, with _R_s being the Spearman correlation coefficient. MMu, immunoglobulin M median units.
Fig. 3
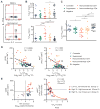
Loss of TH17 cells and inversion of TH17/Treg ratio is related to immune activation and HIV disease progression in peripheral blood. A cross-sectional analysis was carried out on PBMCs from HIV-negative and HIV-infected subjects from the SCOPE Cohort who were controllers (blue triangles), suppressed (green circles), noncontrollers/low CD4 (red diamonds), noncontrollers/high CD4 (yellow triangles), or HIV-seronegative (black circles) (n = 14 in each group) (for further details, see Materials and Methods, Patient populations, Study B, and table S1). In addition, a longitudinal analysis was performed on PBMCs from 27 subjects from the Options Cohort collected at ~3 months (acute) and ~12 months (chronic) after HIV infection. These subjects were divided into three groups (of nine subjects each) on the basis of plasma viral load and T cell immune activation at the second time point: Group 1 with low viral load and low immune activation (purple circles), Group 2 with high viral load and high immune activation (red diamonds), and Group 3 with high viral load and low immune activation (blue squares) (for further details, see Materials and Methods, Patient populations, Study C). Memory (CD45RA−CD27+/−) IL-17A–expressing TH17 cells and FoxP3+ Treg cells were enumerated as described in Materials and Methods. (A) Example of intracellular FACS detection of IL-17A– and IL-2–expressing CD4+ T cells after PMA-ionomycin stimulation on total PBMCs (top panel) and on cells from recto-sigmoid biopsies (bottom panel) from the same HIV controller. (B) Frequencies of memory (mem) TH17 cells (top panel) and Treg cells (bottom panel) in patient groups. (C) TH17/Treg ratio in patient groups. (D) Correlation between TH17/Treg ratio (expressed as log2 memory TH17/Treg cells × 10) with systemic T cell immune activation, as measured by CD38 (left) and Ki67 expression (right) on peripheral blood CD8+ T cells. (E) Viral load and immune activation set points at 12 months after primary HIV infection (left) delineate three groups with either low viral load and low immune activation (Group 1, purple circles), high viral load and high immune activation (Group 2, red diamonds), or high viral load but low immune activation (Group 3, blue squares). Correlation between the frequency of memory TH17 cells during acute infection (3 months after infection) and the change of T cell immune activation between acute to chronic infection, as measured (difference of Ki67+ in CD8+ T cells from 3 to 12 months after infection) (right). Mann-Whitney U test was used for group comparisons (*P < 0.05, **P < 0.005, ***P < 0.0005). The Spearman rank correlation test was used for the correlations, with _R_s being the Spearman correlation coefficient. The correlation (red curve) with P values and _R_s in (E) is indicated for Group 2.
Fig. 4
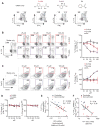
Decrease in the TH17/Treg ratio correlates with increased immune activation in rectosigmoid biopsy tissue and with microbial translocation. Rectosigmoid biopsy cells were studied from 9 controllers and 11 noncontrollers (for further details, see Materials and Methods, Patient populations, Study D, and table S1). (A) Example of intracellular FACS detection of IL-17A and IL-22 (top panels) and of FoxP3 and Ki67 (bottom panels) in CD4+ T cells from rectosigmoid biopsies in representative examples of viral controller and noncontroller subjects. (B) Frequency of TH17 and FoxP3+ Treg cells in rectosigmoid biopsies from noncontrollers compared to controllers. (C) TH17/Treg ratio in patient groups. (D) Correlation between TH17/Treg ratio in rectosigmoid biopsies (expressed as log2 TH17/Treg) and systemic T cell activation as measured by CD38 and Ki67 expression in CD8+ T cell from paired PBMCs. (E) Plasma concentration of 16_S_ rDNA (a marker of bacterial translocation) in samples within the linear range of detection. Mann-Whitney U test was used for group comparisons (*P < 0.05, **P < 0.005, ***P < 0.0005). The Spearman rank correlation test was used for the correlations (_R_s, Spearman correlation coefficient).
Fig. 5
IDO catabolites affect the TH17/Treg ratio. PBMCs from healthy donors were cultured in vitro for 6 days in the presence of different IDO catabolites, including 3-HKA, 3-HAA, and PA. (A) Formulae of the IDO catabolites 3-HKA, 3-HAA, and PA and example of intracellular FACS detection of IL-17A and IFN-γ expression in CD4+ T cells after cell division (CFSElow) for 3-HKA, 3-HAA, and PA compared to media. DMSO, dimethyl sulfoxide. (B) Frequency of IL-17A+IFN-γ− CD4+ T cells after treatment with escalating doses of 3-HKA, 3-HAA, and PA. FACS results from one donor after 3-HKA and 3-HAA treatment are shown in the left panels. Results from four independent experiments with four different donors are at the right panel and show the normalized, mean percent change in TH17 cells (corresponding to the ratio between the frequency of IL-17A+IFN-γ− TH17 cells after treatment with IDO catabolites and the frequency of TH17 cells treated with control vehicle and media alone). (C) Dose-dependent changes in FoxP3+ Treg cells in the same experiments and example as in (B). (D) Dose-dependent changes in TH1 (IL-17A−IFN-γ+ CD4+ T cells) and in proliferation (CFSElow). (E) Correlation between the TH17/Treg ratio and IDO mRNA expression in rectosigmoid biopsy tissues from HIV controller and noncontroller subjects (Cohort Study D). (F) Correlation between the TH17/Treg ratio in PBMCs and K/T ratio in plasma from HIV controller and noncontroller subjects (Cohort Study B). The Spearman rank correlation test was used for the correlations (_R_s, Spearman correlation coefficient).
Comment in
- Insights into therapy: tryptophan oxidation and HIV infection.
Murray MF. Murray MF. Sci Transl Med. 2010 May 19;2(32):32ps23. doi: 10.1126/scitranslmed.3001082. Sci Transl Med. 2010. PMID: 20484729
Similar articles
- Insights into therapy: tryptophan oxidation and HIV infection.
Murray MF. Murray MF. Sci Transl Med. 2010 May 19;2(32):32ps23. doi: 10.1126/scitranslmed.3001082. Sci Transl Med. 2010. PMID: 20484729 - Indoleamine 2,3-dioxygenase-expressing leukemic dendritic cells impair a leukemia-specific immune response by inducing potent T regulatory cells.
Curti A, Trabanelli S, Onofri C, Aluigi M, Salvestrini V, Ocadlikova D, Evangelisti C, Rutella S, De Cristofaro R, Ottaviani E, Baccarani M, Lemoli RM. Curti A, et al. Haematologica. 2010 Dec;95(12):2022-30. doi: 10.3324/haematol.2010.025924. Epub 2010 Aug 26. Haematologica. 2010. PMID: 20801903 Free PMC article. - Clinical Relevance of Kynurenine Pathway in HIV/AIDS: An Immune Checkpoint at the Crossroads of Metabolism and Inflammation.
Routy JP, Mehraj V, Vyboh K, Cao W, Kema I, Jenabian MA. Routy JP, et al. AIDS Rev. 2015 Apr-Jun;17(2):96-106. AIDS Rev. 2015. PMID: 26035167 Review. - Interferon-gamma-triggered indoleamine 2,3-dioxygenase competence in human monocyte-derived dendritic cells induces regulatory activity in allogeneic T cells.
Jürgens B, Hainz U, Fuchs D, Felzmann T, Heitger A. Jürgens B, et al. Blood. 2009 Oct 8;114(15):3235-43. doi: 10.1182/blood-2008-12-195073. Epub 2009 Jul 22. Blood. 2009. PMID: 19625705 - Indoleamine 2,3-dioxygenase in transplantation.
Mulley WR, Nikolic-Paterson DJ. Mulley WR, et al. Nephrology (Carlton). 2008 Jun;13(3):204-11. doi: 10.1111/j.1440-1797.2007.00921.x. Epub 2008 Jan 23. Nephrology (Carlton). 2008. PMID: 18221253 Review.
Cited by
- Immune Characteristics and Immunotherapy of HIV-Associated Lymphoma.
Liu Y, Xie X, Li J, Xiao Q, He S, Fu H, Zhang X, Liu Y. Liu Y, et al. Curr Issues Mol Biol. 2024 Sep 10;46(9):9984-9997. doi: 10.3390/cimb46090596. Curr Issues Mol Biol. 2024. PMID: 39329948 Free PMC article. Review. - The aryl hydrocarbon receptor pathway: a linking bridge between the gut microbiome and neurodegenerative diseases.
Coretti L, Buommino E, Lembo F. Coretti L, et al. Front Cell Neurosci. 2024 Aug 8;18:1433747. doi: 10.3389/fncel.2024.1433747. eCollection 2024. Front Cell Neurosci. 2024. PMID: 39175504 Free PMC article. Review. - The Complex Dysregulations of CD4 T Cell Subtypes in HIV Infection.
Tolomeo M, Cascio A. Tolomeo M, et al. Int J Mol Sci. 2024 Jul 9;25(14):7512. doi: 10.3390/ijms25147512. Int J Mol Sci. 2024. PMID: 39062756 Free PMC article. Review. - Gut microbiome and cardiometabolic comorbidities in people living with HIV.
Trøseid M, Nielsen SD, Vujkovic-Cvijin I. Trøseid M, et al. Microbiome. 2024 Jun 14;12(1):106. doi: 10.1186/s40168-024-01815-y. Microbiome. 2024. PMID: 38877521 Free PMC article. Review. - The combination of Butyricicoccus pullicaecorum and 3-hydroxyanthranilic acid prevents postmenopausal osteoporosis by modulating gut microbiota and Th17/Treg.
Zhu F, Liu H, Cao Y, Dai B, Wu H, Li W. Zhu F, et al. Eur J Nutr. 2024 Aug;63(5):1945-1959. doi: 10.1007/s00394-024-03400-3. Epub 2024 May 16. Eur J Nutr. 2024. PMID: 38753171 Free PMC article.
References
- McCune JM. The dynamics of CD4+ T-cell depletion in HIV disease. Nature. 2001;410:974–979. - PubMed
- Valdez H, Lederman MM. Cytokines and cytokine therapies in HIV infection. AIDS Clin Rev. 1997:187–228. - PubMed
- Murray MF. Tryptophan depletion and HIV infection: A metabolic link to pathogenesis. Lancet Infect Dis. 2003;3:644–652. - PubMed
- Deeks SG, Kitchen CM, Liu L, Guo H, Gascon R, Narváez AB, Hunt P, Martin JN, Kahn JO, Levy J, McGrath MS, Hecht FM. Immune activation set point during early HIV infection predicts subsequent CD4+ T-cell changes independent of viral load. Blood. 2004;104:942–947. - PubMed
Publication types
MeSH terms
Substances
Grants and funding
- R01 AI066917/AI/NIAID NIH HHS/United States
- P01 AI071713/AI/NIAID NIH HHS/United States
- K01 AI066917/AI/NIAID NIH HHS/United States
- T32 DK007762/DK/NIDDK NIH HHS/United States
- K24 AI069994/AI/NIAID NIH HHS/United States
- K08 DK083334/DK/NIDDK NIH HHS/United States
- P30 MH59037/MH/NIMH NIH HHS/United States
- P30 AI027763/AI/NIAID NIH HHS/United States
- DPI OD00329/OD/NIH HHS/United States
- R37 AI040312/AI/NIAID NIH HHS/United States
- K08 DK083334-01A1/DK/NIDDK NIH HHS/United States
- P30 AI27763/AI/NIAID NIH HHS/United States
- R37 AI40312/AI/NIAID NIH HHS/United States
- R01 K23 AI065244/AI/NIAID NIH HHS/United States
- P30 AI022763/AI/NIAID NIH HHS/United States
- UL1 RR024131/RR/NCRR NIH HHS/United States
- K23 AI065244/AI/NIAID NIH HHS/United States
- DP1 OD000329/OD/NIH HHS/United States
- AI069994/AI/NIAID NIH HHS/United States
- ImNIH/Intramural NIH HHS/United States
- K24 DK060617/DK/NIDDK NIH HHS/United States
LinkOut - more resources
Full Text Sources
Other Literature Sources
Medical
Research Materials


