A large fraction of extragenic RNA pol II transcription sites overlap enhancers - PubMed (original) (raw)
A large fraction of extragenic RNA pol II transcription sites overlap enhancers
Francesca De Santa et al. PLoS Biol. 2010.
Abstract
Mammalian genomes are pervasively transcribed outside mapped protein-coding genes. One class of extragenic transcription products is represented by long non-coding RNAs (lncRNAs), some of which result from Pol_II transcription of bona-fide RNA genes. Whether all lncRNAs described insofar are products of RNA genes, however, is still unclear. Here we have characterized transcription sites located outside protein-coding genes in a highly regulated response, macrophage activation by endotoxin. Using chromatin signatures, we could unambiguously classify extragenic Pol_II binding sites as belonging to either canonical RNA genes or transcribed enhancers. Unexpectedly, 70% of extragenic Pol_II peaks were associated with genomic regions with a canonical chromatin signature of enhancers. Enhancer-associated extragenic transcription was frequently adjacent to inducible inflammatory genes, was regulated in response to endotoxin stimulation, and generated very low abundance transcripts. Moreover, transcribed enhancers were under purifying selection and contained binding sites for inflammatory transcription factors, thus suggesting their functionality. These data demonstrate that a large fraction of extragenic Pol_II transcription sites can be ascribed to cis-regulatory genomic regions. Discrimination between lncRNAs generated by canonical RNA genes and products of transcribed enhancers will provide a framework for experimental approaches to lncRNAs and help complete the annotation of mammalian genomes.
Conflict of interest statement
The authors have declared that no competing interests exist.
Figures
Figure 1. Sites of regulated extragenic transcription upstream of LPS-inducible genes.
(A) Pol_II ChIP-Seq data from unstimulated and LPS+γIFN-stimulated macrophages at the Ccl5 gene and surrounding genomic regions. The extragenic Pol_II peaks (indicated as −1, −2, and −3) and the genomic annotations (mm9) are shown. The _y_-axis indicates the number of ChIP-Seq tags. (B) Phosphorylated Ser5 Pol_II ChIP-Seq data at the same genomic region. UT, untreated macrophages.
Figure 2. Inducible upstream extragenic transcription frequently precedes the activation of the adjacent protein-coding gene.
Kinetics of induction of Ccl5 (A) and Cxcl11 (B) mRNAs relative to those of the upstream extragenic transcripts. Extragenic Ccl5 transcripts (#−1, −2, and −3) correspond to the Pol_II peaks shown in Figure 1. Cxcl11 transcripts #−1 and #−2 correspond to the regions in Figure S1A. Cells were stimulated with LPS+γIFN as indicated. _y_-axes indicate mRNA (left) or ncRNA (right) levels relative to those of a housekeeping gene (TBP). (C) Kinetics of mRNA induction of a panel of protein-coding genes together with the associated extragenic transcripts. The corresponding Pol_II ChIP_seq data (2h LPS+γIFN stimulation) are shown on the right. Shaded areas indicate the extragenic Pol_II peaks. For Trim25 and Zcchc2, amplicons correspond to the Pol_II peak closest to the 5′ of the gene.
Figure 3. Characterization of the extragenic transcripts generated upstream of LPS-inducible genes.
(A) Polyadenylation of extragenic Ccl5 transcripts. Total RNA was reverse-transcribed using oligo-dT primers. cDNA was then amplified with primers corresponding to regions −1, −2, and −3 upstream of Ccl5 (as in Figure 1). (B) Upstream extragenic transcripts are nuclear RNAs. Macrophages were fractionated before RNA extraction. RNA from the cytoplasmic and nuclear fractions was then reverse transcribed and amplified with the indicated primers. Neat1 is a nuclear non-coding RNA that was used as a control of the fractionation procedure. (C) Extragenic transcription upstream of Ccl5 generates long unspliced transcripts. RNA was reverse transcribed using antisense primers in the region just upstream of Ccl5 TSS, as indicated. cDNA was then PCR-amplified using primers in the extragenic region −1 (as in Figure 1A). (D) Extragenic Ccl5 and Cxcl11 transcripts are very unstable. Cells were stimulated with LPS for 2 h, followed by a 30 min actinomycinD (5 µg/ml) chase. mRNAs for Ccl5 and Cxcl11 and the corresponding extragenic transcripts were measured by quantitative PCR. UT, untreated. (E) DRB insensitivity of extragenic Ccl5 and Cxcl11 transcripts. Macrophages were stimulated with LPS for 2 h in the presence or absence of DRB (50 µg/ml), as indicated. UT, untreated.
Figure 4. Identification of enhancer-associated and promoter-associated extragenic Pol_II transcription sites.
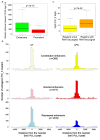
(A) Pie chart showing the three groups of extragenic Pol_II peaks (classified on the basis of Pol_II changes after stimulation) in untreated and LPS+γIFN-treated macrophages. Numbers refer to Pol_II peaks before SVM classification, clusterization, and filtering against Ensembl protein-coding genes. (B) The pie chart shows the results of the machine-learning approach used to classify extragenic Pol_II clusters as belonging to promoters or enhancers. Numbers refer to Pol_II peaks after clusterization and filtering against Ensembl protein-coding genes. (C) Enhancer and promoter predictions. Regions of extragenic Pol_II transcription were classified as enhancers or promoters/TSSs using a machine-learning algorithm recognizing alternative H3K4me3/H3K4me1 patterns. Each line represents a 5 kb region centered around the summit of a Pol_II peak (±2.5 kb). Peaks are shown from chromosome 1 (top) to chromosome X (bottom). (D) Examples of predicted promoters and enhancers. ChIP-Seq profiles at regions containing representative extragenic transcription sites belonging to the two groups are shown. The coordinates indicate the position of the Pol_II peak. The green square indicates a CpG island. (E) Association of predicted enhancers and promoters with CpG islands. Expected and observed fractions are shown. (F) Correlation between LPS-induced Pol_II changes at predicted transcribed enhancers and at the neighboring protein-coding gene. Inducible enhancers (upper panel) and repressed enhancers (lower panel) are shown. Observed (obs) and expected (exp) fractions for each group of genes (constitutive, repressed, and inducible genes) are shown together with the respective p value (the p value may refer to either an over- or an under-representation). Expected fractions were calculated on the basis of the relative frequency of each group (constitutive, induced, repressed genes) with respect to all Pol_II positive genes. n.s., non-significant.
Figure 5. Evidence for active transcription at Pol_II-associated enhancers.
(A) Distribution of the median distance between CAGE tags clusters overlapping the regions predicted as either enhancers or promoters. (B) Correlation between total and active Pol_II (phosphorylated at Ser5 of the CTD) at enhancers. The graphs illustrate the distance between extragenic Pol_II peaks predicted as enhancers and the closest P-Ser5 Pol_II peak. (C) Extragenic regions associated with RNA_Seq signals display higher Pol_II occupancy than those without RNA-Seq signals.
Figure 6. Signatures of functionality at enhancer-associated extragenic transcription sites.
(A) Sequence conservation at extragenic Pol_II transcription sites. Average conservation scores (phastCons score per bp) in the enhancer, promoter, and unpredictable groups are shown. Pol_II peaks were centered around their summit. (B) Statistical significance of sequence conservation in the three groups was evaluated as compared to random sets. The _y_-axis indicates the p value of the deviation from random. The horizontal grey line indicates the threshold for statistical significance (set to p<0.01). (C) Functional evaluation of predicted enhancers in reporter assays. The indicated regions were subcloned in the pGL3 promoter vector, which bears a minimal promoter, and transfected in Raw264.7 macrophage cells. Cells were stimulated with LPS for 16 h before harvesting. Errors bars, S.D. (D) Overlap of extragenic transcription sites with an enhancer-associated chromatin signature with experimentally determined binding sites of the hematopoietic transcription factor PU.1. PU.1 peaks ± 500 bp (identified in a ChIP-Seq experiment in untreated macrophages) were considered. Black numbers refer to Pol_II clusters, while blue numbers refer to PU.1 peaks.
Figure 7. Enrichment of transcription factor binding sites in enhancer-type extragenic Pol_II transcription sites.
(A) TFBSs enriched in the set of inducible, enhancer-type extragenic transcription sites. Enrichment was evaluated using two reference datasets (see Methods). Each vertical column in the heat-plot represents a Pol_II peak, while each row corresponds to an enriched PWM. Data are shown after hierarchical clustering. Selected enriched PWMs for inflammatory TFs (IRFs, STAT1, NF-kB) are shown on the right. Increasing red color represents increasing probabilities for a PWM to have a match in the region as compared to randomized sequences with the same nucleotide composition . (B) IRF3 and NF-kB are required for extragenic transcription upstream of Ccl5. Raw264.7 cell lines constitutively expressing a dominant negative Irf3 (IRF3DN) or a general inhibitor of NF-kB (IkBα super-repressor, IkBαDN) were stimulated with LPS as indicated and Ccl5 mRNA or upstream extragenic transcripts were measured by RT Q-PCR. (C) Binding of NF-kB to the Ccl5 promoter and to a region corresponding to the −1 Pol_II peak. NF-kB binding was measured using an anti-p65 ChIP.
Figure 8. Functional consequences of transcriptional inhibition on extragenic histone acetylation at the Ccl5 and Cxcl11 loci.
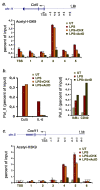
(A) H3K9 acetylation at the transcribed region (about 5 kb) upstream of Ccl5 was measured by ChIP in the absence or presence of CHX (10 µg/ml) or ActD (5 µg/ml) as indicated. UT, untreated macrophages. Position of the amplicons (transcription start site [TSS] and five extragenic amplicons indicated by progressive numbers) is indicated. (B) Left panel: inhibition of transcription but not translation blocks the activation of the primary response gene Ccl5 . Conversely, Pol_II recruitment to the TSS of the secondary gene IL-6 is equally sensitive to CHX and ActD. Right panel: ActD does not inhibit Pol_II recruitment to IkBα and CD40. (C) Transcription is required for inducible H3K9 hyperacetylation at the transcribed region upstream of Cxcl11. The position of amplicons at the TSS and upstream of the gene are indicated.
Similar articles
- Noncoding transcription at enhancers: general principles and functional models.
Natoli G, Andrau JC. Natoli G, et al. Annu Rev Genet. 2012;46:1-19. doi: 10.1146/annurev-genet-110711-155459. Epub 2012 Aug 16. Annu Rev Genet. 2012. PMID: 22905871 Review. - Enhancer SINEs Link Pol III to Pol II Transcription in Neurons.
Policarpi C, Crepaldi L, Brookes E, Nitarska J, French SM, Coatti A, Riccio A. Policarpi C, et al. Cell Rep. 2017 Dec 5;21(10):2879-2894. doi: 10.1016/j.celrep.2017.11.019. Cell Rep. 2017. PMID: 29212033 Free PMC article. - Temporal ChIP-on-Chip of RNA-Polymerase-II to detect novel gene activation events during photoreceptor maturation.
Tummala P, Mali RS, Guzman E, Zhang X, Mitton KP. Tummala P, et al. Mol Vis. 2010 Feb 17;16:252-71. Mol Vis. 2010. PMID: 20161818 Free PMC article. - Extragenic accumulation of RNA polymerase II enhances transcription by RNA polymerase III.
Listerman I, Bledau AS, Grishina I, Neugebauer KM. Listerman I, et al. PLoS Genet. 2007 Nov;3(11):e212. doi: 10.1371/journal.pgen.0030212. PLoS Genet. 2007. PMID: 18039033 Free PMC article. - Enhancer biology and enhanceropathies.
Smith E, Shilatifard A. Smith E, et al. Nat Struct Mol Biol. 2014 Mar;21(3):210-9. doi: 10.1038/nsmb.2784. Nat Struct Mol Biol. 2014. PMID: 24599251 Review.
Cited by
- A guide to studying 3D genome structure and dynamics in the kidney.
Beliveau BJ, Akilesh S. Beliveau BJ, et al. Nat Rev Nephrol. 2024 Oct 15. doi: 10.1038/s41581-024-00894-2. Online ahead of print. Nat Rev Nephrol. 2024. PMID: 39406927 Review. - An RNA-centric view of transcription and genome organization.
Henninger JE, Young RA. Henninger JE, et al. Mol Cell. 2024 Oct 3;84(19):3627-3643. doi: 10.1016/j.molcel.2024.08.021. Mol Cell. 2024. PMID: 39366351 Review. - The regulatory landscape of interacting RNA and protein pools in cellular homeostasis and cancer.
Gallardo-Dodd CJ, Kutter C. Gallardo-Dodd CJ, et al. Hum Genomics. 2024 Sep 27;18(1):109. doi: 10.1186/s40246-024-00678-6. Hum Genomics. 2024. PMID: 39334294 Free PMC article. Review. - CRISPR Screening of Transcribed Super-Enhancers Identifies Drivers of Triple-Negative Breast Cancer Progression.
Lewis MW, King CM, Wisniewska K, Regner MJ, Coffey A, Kelly MR, Mendez-Giraldez R, Davis ES, Phanstiel DH, Franco HL. Lewis MW, et al. Cancer Res. 2024 Nov 4;84(21):3684-3700. doi: 10.1158/0008-5472.CAN-23-3995. Cancer Res. 2024. PMID: 39186674 - The enhancer RNA, AANCR, regulates APOE expression in astrocytes and microglia.
Wan M, Liu Y, Li D, Snyder RJ, Elkin LB, Day CR, Rodriguez J, Grunseich C, Mahley RW, Watts JA, Cheung VG. Wan M, et al. Nucleic Acids Res. 2024 Sep 23;52(17):10235-10254. doi: 10.1093/nar/gkae696. Nucleic Acids Res. 2024. PMID: 39162226 Free PMC article.
References
- Prasanth K. V, Spector D. L. Eukaryotic regulatory RNAs: an answer to the ‘genome complexity’ conundrum. Genes Dev. 2007;21:11–42. - PubMed
- Mercer T. R, Dinger M. E, Mattick J. S. Long non-coding RNAs: insights into functions. Nat Rev Genet. 2009;10:155–159. - PubMed
- Sharp P. A. The centrality of RNA. Cell. 2009;136:577–580. - PubMed
Publication types
MeSH terms
Substances
LinkOut - more resources
Full Text Sources
Other Literature Sources


