Treatment of traumatic brain injury with thymosin β₄ in rats - PubMed (original) (raw)
Treatment of traumatic brain injury with thymosin β₄ in rats
Ye Xiong et al. J Neurosurg. 2011 Jan.
Abstract
Object: This study was designed to investigate the efficacy of delayed thymosin β(4) (Tβ(4)) treatment of traumatic brain injury (TBI) in rats.
Methods: Young adult male Wistar rats were divided into the following groups: 1) sham group (6 rats); 2) TBI + saline group (9 rats); 3) and TBI + Tβ(4) group (10 rats). Traumatic brain injury was induced by controlled cortical impact over the left parietal cortex. Thymosin β(4) (6 mg/kg) or saline was administered intraperitoneally starting at Day 1 and then every 3 days for an additional 4 doses. Neurological function was assessed using a modified neurological severity score (mNSS), foot fault, and Morris water maze tests. Animals were killed 35 days after injury, and brain sections were stained for immunohistochemistry to assess angiogenesis, neurogenesis, and oligodendrogenesis after Tβ(4) treatment.
Results: Compared with the saline treatment, delayed Tβ(4) treatment did not affect lesion volume but significantly reduced hippocampal cell loss, enhanced angiogenesis and neurogenesis in the injured cortex and hippocampus, increased oligodendrogenesis in the CA3 region, and significantly improved sensorimotor functional recovery and spatial learning.
Conclusions: These data for the first time demonstrate that delayed administration of Tβ(4) significantly improves histological and functional outcomes in rats with TBI, indicating that Tβ(4) has considerable therapeutic potential for patients with TBI.
Figures
Fig. 1
The effect of Tβ4 on functional recovery after TBI**. A:** Effect of Tβ4 on spatial learning function 31–35 days after TBI. TBI significantly impairs spatial learning at Days 32–35 compared to sham controls. Delayed treatment with Tβ4 improves spatial learning performance measured by a recent version of the water maze test at Days 33–35 compared with the saline group. B: Effect of Tβ4 on sensorimotor function (forelimb footfault) after TBI. TBI significantly impairs sensorimotor function at Days 1–35 compared with sham controls. Delayed Tβ4 treatment significantly reduces forelimb foot faults at Days 7–35 compared with the saline-treated group. C: Effect of Tβ4 on sensorimotor function (hindlimb footfault) after TBI. TBI significantly impairs sensorimotor function at Days 1–35 compared with sham controls. Delayed Tβ4 treatment significantly reduces hindlimb foot faults at Days 7–35 compared with the saline-treated group. D: Line graph showing the functional improvement detected on the mNSS. Treatment with Tβ4 significantly lowers mNSS scores at Days 7–35 compared with the saline group. Data represent mean ± SD. There were 6, 9, and 10 rats in the sham, saline, and Tβ4 groups, respectively. Pre = preinjury level.
Fig. 2
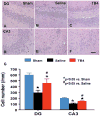
The effect of TB4 on cell number in the ipsilateral dentate gyrus and CA3 region at 35 days after TBI. H&E staining: A-F. Delayed treatment with TB4 (C, F) significantly reduces cell loss as compared with the saline-treated group (B, E) (p < 0.05). The cell number in the dentate gyrus and CA3 region is shown in (G). Scale bar = 25μm (F, applicable to A–F). Data represent mean ± SD. *p < 0.05 vs Sham group. #p < 0.05 vs Saline group. N (rats/group) = 6 (Sham); 9 (Saline); and 10 (TB4).
Fig. 3
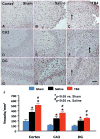
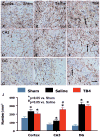
The effect of TB4 on vWF-staining vascular structure in the injured cortex, ipsilateral dentate gyrus, and CA3 region 35 days after TBI. TBI alone (B, E, and H) significantly increases the vascular density in these regions compared to sham controls (p < 0.05). TB4 treatment (C, F, and I; arrow as example showing vWF-staining vascular structure) further enhances angiogenesis after TBI compared to the saline-treated groups (p < 0.05). The density of vWF-stained vasculature is shown in (J). Scale bar = 50 μm (I, applicable to A-I). Data represent mean ± SD. *p < 0.05 vs Sham group. #p < 0.05 vs Saline group. N (rats/group) = 6 (Sham); 9 (Saline); and 10 (TB4).
Fig. 4
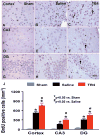
The effect of TB4 on BrdU+ cells in the injured cortex, ipsilateral CA3, and dentate gyrus 35 days after TBI. TBI alone (B, E, and H) significantly increases the number of BrdU+ cells in the ipsilateral cortex, CA3 and dentate gyrus compared to sham controls (A, D, and G) (p < 0.05). TB4 treatment significantly increases the number of BrdU+ cells in these regions (C, F, and I; arrow as example showing BrdU+ cell) compared to the saline-treated groups (p < 0.05). The number of BrdU+ cells is shown in (J). Scale bar = 25μm (I, applicable to A–I). Data represent mean ± SD. *p < 0.05 vs Sham group. #p < 0.05 vs Saline group. N (rats/group) = 6 (Sham); 9 (Saline); and 10 (TB4).
Fig. 5
The effect of TB4 on oligodendrocyte progenitor cells (NG2+) in the injured cortex, ipsilateral CA3 and dentate gyrus 35 days after TBI. TBI alone (B, E, and H) significantly increases the number of NG2+ cells in the ipsilateral cortex, CA3 and dentate gyrus compared to sham controls (A, D, and G) (p < 0.05). TB4 treatment does not affect the number of NG2+ cells in these regions (C, F, and I; arrow as example showing NG2+ cell) compared to the saline-treated groups. The number of BrdU+ cells is shown in (J). Scale bar = 25μm (I, applicable to A–I). Data represent mean ± SD. *p < 0.05 vs Sham group. N (rats/group) = 6 (Sham); 9 (Saline); and 10 (TB4).
Fig. 6
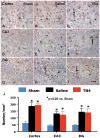
The effect of TB4 on mature oligodendrocytes (CNPase+) in the injured cortex, ipsilateral CA3, and dentate gyrus 35 days after TBI. TBI alone (B, E, and H) significantly increases the number of CNPase+ cells in the ipsilateral cortex, CA3, and dentate gyrus compared to sham controls (A, D, and G) (p < 0.05). TB4 treatment does not affect the number of CNPase+ cells in the cortex (C, arrow as example showing CNPase+ cell) and DG (I) but significantly increases the number of CNPase+ cells in the CA3 region (F) compared to saline groups. The number of BrdU+ cells is shown in (J). Scale bar = 25μm (I, applicable to A–I). Data represent mean ± SD. *p < 0.05 vs Sham group. #p < 0.05 vs Saline group. N (rats/group) = 6 (Sham); 9 (Saline); and 10 (TB4).
Fig. 7
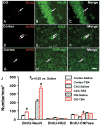
Double immunofluorescent staining for BrdU (red) and NeuN (green) to identify newborn neurons (yellow after merge) in the brain (A–C), for BrdU (red) and NG2 (green) to identify newborn OPCs in the brain (D–F), and for BrdU (red) and CNPase (green) to identify newborn mature oligodendrocytes in the brain (G–I). The arrows indicate newborn neurons (A–C), OPCs (D–F) and mature oligodendrocytes (G–I). Bar = 25 um (for all panels). J: Bar graph showing the numbers of NeuN+, NG2+, and CNPase+ cells colabeled with BrdU. Scale bar = 25μm (I, applicable to A–I). Data represent mean ± SD. #p < 0.05 vs Saline group. N (rats/group) = 6 (Sham); 9 (Saline); and 10 (TB4).
Similar articles
- Neuroprotective and neurorestorative effects of thymosin β4 treatment initiated 6 hours after traumatic brain injury in rats.
Xiong Y, Zhang Y, Mahmood A, Meng Y, Zhang ZG, Morris DC, Chopp M. Xiong Y, et al. J Neurosurg. 2012 May;116(5):1081-92. doi: 10.3171/2012.1.JNS111729. Epub 2012 Feb 10. J Neurosurg. 2012. PMID: 22324420 Free PMC article. - Dose-dependent neurorestorative effects of delayed treatment of traumatic brain injury with recombinant human erythropoietin in rats.
Meng Y, Xiong Y, Mahmood A, Zhang Y, Qu C, Chopp M. Meng Y, et al. J Neurosurg. 2011 Sep;115(3):550-60. doi: 10.3171/2011.3.JNS101721. Epub 2011 Apr 15. J Neurosurg. 2011. PMID: 21495821 Free PMC article. - Effects of posttraumatic carbamylated erythropoietin therapy on reducing lesion volume and hippocampal cell loss, enhancing angiogenesis and neurogenesis, and improving functional outcome in rats following traumatic brain injury.
Xiong Y, Mahmood A, Zhang Y, Meng Y, Zhang ZG, Qu C, Sager TN, Chopp M. Xiong Y, et al. J Neurosurg. 2011 Feb;114(2):549-59. doi: 10.3171/2010.10.JNS10925. Epub 2010 Nov 12. J Neurosurg. 2011. PMID: 21073254 Free PMC article. - Treatment of neurological injury with thymosin β4.
Morris DC, Zhang ZG, Zhang J, Xiong Y, Zhang L, Chopp M. Morris DC, et al. Ann N Y Acad Sci. 2012 Oct;1269(1):110-6. doi: 10.1111/j.1749-6632.2012.06651.x. Ann N Y Acad Sci. 2012. PMID: 23045978 Free PMC article. Review. - Angiogenesis, neurogenesis and brain recovery of function following injury.
Xiong Y, Mahmood A, Chopp M. Xiong Y, et al. Curr Opin Investig Drugs. 2010 Mar;11(3):298-308. Curr Opin Investig Drugs. 2010. PMID: 20178043 Free PMC article. Review.
Cited by
- Thymosin β 4 mediates oligodendrocyte differentiation by upregulating p38 MAPK.
Santra M, Chopp M, Zhang ZG, Lu M, Santra S, Nalani A, Santra S, Morris DC. Santra M, et al. Glia. 2012 Dec;60(12):1826-38. doi: 10.1002/glia.22400. Epub 2012 Aug 1. Glia. 2012. PMID: 23073962 Free PMC article. - miR-146a mediates thymosin β4 induced neurovascular remodeling of diabetic peripheral neuropathy in type-II diabetic mice.
Wang L, Chopp M, Lu X, Szalad A, Jia L, Liu XS, Wu KH, Lu M, Zhang ZG. Wang L, et al. Brain Res. 2019 Mar 15;1707:198-207. doi: 10.1016/j.brainres.2018.11.039. Epub 2018 Nov 27. Brain Res. 2019. PMID: 30500399 Free PMC article. - Mesenchymal Stem Cell-Derived Exosomes Improve Functional Recovery in Rats After Traumatic Brain Injury: A Dose-Response and Therapeutic Window Study.
Zhang Y, Zhang Y, Chopp M, Zhang ZG, Mahmood A, Xiong Y. Zhang Y, et al. Neurorehabil Neural Repair. 2020 Jul;34(7):616-626. doi: 10.1177/1545968320926164. Epub 2020 May 28. Neurorehabil Neural Repair. 2020. PMID: 32462980 Free PMC article. - Neuroprotective and neurorestorative effects of thymosin β4 treatment following experimental traumatic brain injury.
Xiong Y, Mahmood A, Meng Y, Zhang Y, Zhang ZG, Morris DC, Chopp M. Xiong Y, et al. Ann N Y Acad Sci. 2012 Oct;1270:51-8. doi: 10.1111/j.1749-6632.2012.06683.x. Ann N Y Acad Sci. 2012. PMID: 23050817 Free PMC article. - Subacute intranasal administration of tissue plasminogen activator promotes neuroplasticity and improves functional recovery following traumatic brain injury in rats.
Meng Y, Chopp M, Zhang Y, Liu Z, An A, Mahmood A, Xiong Y. Meng Y, et al. PLoS One. 2014 Sep 3;9(9):e106238. doi: 10.1371/journal.pone.0106238. eCollection 2014. PLoS One. 2014. PMID: 25184365 Free PMC article.
References
- Barth TM, Jones TA, Schallert T. Functional subdivisions of the rat somatic sensorimotor cortex. Behav Brain Res. 1990;39:73–95. - PubMed
- Baskin YK, Dietrich WD, Green EJ. Two effective behavioral tasks for evaluating sensorimotor dysfunction following traumatic brain injury in mice. J Neurosci Methods. 2003;129:87–93. - PubMed
- Bednarek R, Boncela J, Smolarczyk K, Cierniewska-Cieslak A, Wyroba E, Cierniewski CS. Ku80 as a novel receptor for thymosin beta4 that mediates its intracellular activity different from G-actin sequestering. J Biol Chem. 2008;283:1534–1544. - PubMed
- Bock-Marquette I, Saxena A, White MD, Dimaio JM, Srivastava D. Thymosin beta4 activates integrin-linked kinase and promotes cardiac cell migration, survival and cardiac repair. Nature. 2004;432:466–472. - PubMed
Publication types
MeSH terms
Substances
Grants and funding
- R01 NS62002/NS/NINDS NIH HHS/United States
- P01 NS042345-050002/NS/NINDS NIH HHS/United States
- P01 NS042345/NS/NINDS NIH HHS/United States
- R01 NS062002/NS/NINDS NIH HHS/United States
- R01 NS062002-03/NS/NINDS NIH HHS/United States
- P01 NS42345/NS/NINDS NIH HHS/United States
LinkOut - more resources
Full Text Sources
Other Literature Sources
Miscellaneous

