Optimal contact definition for reconstruction of contact maps - PubMed (original) (raw)
Optimal contact definition for reconstruction of contact maps
Jose M Duarte et al. BMC Bioinformatics. 2010.
Abstract
Background: Contact maps have been extensively used as a simplified representation of protein structures. They capture most important features of a protein's fold, being preferred by a number of researchers for the description and study of protein structures. Inspired by the model's simplicity many groups have dedicated a considerable amount of effort towards contact prediction as a proxy for protein structure prediction. However a contact map's biological interest is subject to the availability of reliable methods for the 3-dimensional reconstruction of the structure.
Results: We use an implementation of the well-known distance geometry protocol to build realistic protein 3-dimensional models from contact maps, performing an extensive exploration of many of the parameters involved in the reconstruction process. We try to address the questions: a) to what accuracy does a contact map represent its corresponding 3D structure, b) what is the best contact map representation with regard to reconstructability and c) what is the effect of partial or inaccurate contact information on the 3D structure recovery. Our results suggest that contact maps derived from the application of a distance cutoff of 9 to 11A around the Cbeta atoms constitute the most accurate representation of the 3D structure. The reconstruction process does not provide a single solution to the problem but rather an ensemble of conformations that are within 2A RMSD of the crystal structure and with lower values for the pairwise average ensemble RMSD. Interestingly it is still possible to recover a structure with partial contact information, although wrong contacts can lead to dramatic loss in reconstruction fidelity.
Conclusions: Thus contact maps represent a valid approximation to the structures with an accuracy comparable to that of experimental methods. The optimal contact definitions constitute key guidelines for methods based on contact maps such as structure prediction through contacts and structural alignments based on maximum contact map overlap.
Figures
Figure 1
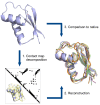
Schematic representation of the optimization procedure. 1) the native structure is decomposed into contact maps based on different definitions, 2) the 3D structure is reconstructed from contact information only, obtaining an ensemble of conformations, 3) the accuracy is measured against the original structure. The protein shown is PDB structure 1bxyA. The ensemble corresponds to 6 reconstructions (ribbon representation) in different colours and also contains the native protein (cartoon representation) in blue.
Figure 2
Accuracy of reconstructions. Reconstruction C α RMSD vs. distance cutoff for each of the contact definitions. Plotted are the mean accuracy values for the set of 60 proteins for C α, C β and C α + C β contact definitions. Horizontal lines mark the minimum RMSD for each of them. The error bars represent the standard deviation across the distribution of 60 proteins.
Figure 3
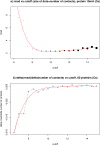
Number of contacts and reconstruction accuracy. a) RMSD values for the protein 1bkrA using C α as contact definition, the size of the dots represent the total number of contacts in the contact map for a particular cutoff. The red curve is a linear fit to a polynomial. b) RMSD delta over delta of number of contacts against the cut-off for C α contact definition for the average of the 60 proteins in the data set. The red curve is again a linear fit to a polynomial.
Figure 4
Variability for different SCOP classes. Reconstruction accuracy comparison for proteins in the four SCOP classes, using boxplots to depict the distributions of RMSD values. There are exactly 15 proteins per class from the set of 60 PDB representatives. a) For C α b) for C β and c) C α + C β, all three at 9Å cutoff.
Figure 5
Comparison to previous studies. Comparison of our reconstruction RMSD values (black) with those of Vassura et al. (green) and Vendruscolo et al (red). The set is the one used by Vendruscolo and subsequently by Vassura. Two proteins were eliminated from their set because of ambiguities with the data. The error bars are for the variability across different runs (not reported by Vassura).
Figure 6
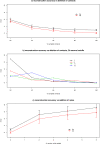
Reconstruction for incomplete or noisy maps. Behaviour of the reconstruction algorithm with noise or incomplete data. a) random subsets are sampled for C α and C β maps, b) random subsets are sampled for C β maps at different cut-offs (7, 9, 11 and 13, with different colours) and c) random contact noise is added to the map (C α and C β maps). The 12 proteins subset (see Methods) was used for this analysis. For each of the levels of noise 10 random samples were taken and 30 models generated. The variability within the different proteins in the set is represented with the error bars.
Similar articles
- A two-stage approach for improved prediction of residue contact maps.
Vullo A, Walsh I, Pollastri G. Vullo A, et al. BMC Bioinformatics. 2006 Mar 30;7:180. doi: 10.1186/1471-2105-7-180. BMC Bioinformatics. 2006. PMID: 16573808 Free PMC article. - Toward an accurate prediction of inter-residue distances in proteins using 2D recursive neural networks.
Kukic P, Mirabello C, Tradigo G, Walsh I, Veltri P, Pollastri G. Kukic P, et al. BMC Bioinformatics. 2014 Jan 10;15:6. doi: 10.1186/1471-2105-15-6. BMC Bioinformatics. 2014. PMID: 24410833 Free PMC article. - Reconstruction of protein structures from a vectorial representation.
Porto M, Bastolla U, Roman HE, Vendruscolo M. Porto M, et al. Phys Rev Lett. 2004 May 28;92(21):218101. doi: 10.1103/PhysRevLett.92.218101. Epub 2004 May 28. Phys Rev Lett. 2004. PMID: 15245321 - The pros and cons of predicting protein contact maps.
Bartoli L, Capriotti E, Fariselli P, Martelli PL, Casadio R. Bartoli L, et al. Methods Mol Biol. 2008;413:199-217. doi: 10.1007/978-1-59745-574-9_8. Methods Mol Biol. 2008. PMID: 18075167 Review. - Protein folding using contact maps.
Vendruscolo M, Domany E. Vendruscolo M, et al. Vitam Horm. 2000;58:171-212. doi: 10.1016/s0083-6729(00)58025-x. Vitam Horm. 2000. PMID: 10668399 Review.
Cited by
- StructureDistiller: Structural relevance scoring identifies the most informative entries of a contact map.
Bittrich S, Schroeder M, Labudde D. Bittrich S, et al. Sci Rep. 2019 Dec 6;9(1):18517. doi: 10.1038/s41598-019-55047-4. Sci Rep. 2019. PMID: 31811259 Free PMC article. - Insights into the Dissociation Process and Binding Pattern of the BRCT7/8-PHF8 Complex.
Yuan L, Liang X, He L. Yuan L, et al. ACS Omega. 2024 May 2;9(19):20819-20831. doi: 10.1021/acsomega.3c09433. eCollection 2024 May 14. ACS Omega. 2024. PMID: 38764655 Free PMC article. - Forecasting residue-residue contact prediction accuracy.
Wozniak PP, Konopka BM, Xu J, Vriend G, Kotulska M. Wozniak PP, et al. Bioinformatics. 2017 Nov 1;33(21):3405-3414. doi: 10.1093/bioinformatics/btx416. Bioinformatics. 2017. PMID: 29036497 Free PMC article. - Applying PyRosetta molecular energies to separate properly oriented protein models from mirror models, obtained from contact maps.
Kurczynska M, Kania E, Konopka BM, Kotulska M. Kurczynska M, et al. J Mol Model. 2016 May;22(5):111. doi: 10.1007/s00894-016-2975-3. Epub 2016 Apr 23. J Mol Model. 2016. PMID: 27107578 Free PMC article. - Evolutionary couplings detect side-chain interactions.
Hockenberry AJ, Wilke CO. Hockenberry AJ, et al. PeerJ. 2019 Jul 8;7:e7280. doi: 10.7717/peerj.7280. eCollection 2019. PeerJ. 2019. PMID: 31328041 Free PMC article.
References
- Phillips DC. The development of crystallographic enzymology. Biochem Soc Symp. 1970;11:11–28. - PubMed
- Nishikawa K, Ooi T, Isogai Y, Saito N. Tertiary Structure of Proteins. I. Representation and Computation of the Conformations. Journal of the Physical Society of Japan. 1972;11:1331–1337. doi: 10.1143/JPSJ.32.1331. - DOI
MeSH terms
Substances
LinkOut - more resources
Full Text Sources


