HDAC6 regulates mitochondrial transport in hippocampal neurons - PubMed (original) (raw)
HDAC6 regulates mitochondrial transport in hippocampal neurons
Sigeng Chen et al. PLoS One. 2010.
Abstract
Background: Tubulin is a major substrate of the cytoplasmic class II histone deacetylase HDAC6. Inhibition of HDAC6 results in higher levels of acetylated tubulin and enhanced binding of the motor protein kinesin-1 to tubulin, which promotes transport of cargoes along microtubules. Microtubule-dependent intracellular trafficking may therefore be regulated by modulating the activity of HDAC6. We have shown previously that the neuromodulator serotonin increases mitochondrial movement in hippocampal neurons via the Akt-GSK3beta signaling pathway. Here, we demonstrate a role for HDAC6 in this signaling pathway.
Methodology/principal findings: We found that the presence of tubacin, a specific HDAC6 inhibitor, dramatically enhanced mitochondrial movement in hippocampal neurons, whereas niltubacin, an inactive tubacin analog, had no effect. Compared to control cultures, higher levels of acetylated tubulin were found in neurons treated with tubacin, and more kinesin-1 was associated with mitochondria isolated from these neurons. Inhibition of GSK3beta decreased cytoplasmic deacetylase activity and increased tubulin acetylation, whereas blockade of Akt, which phosphorylates and down-regulates GSK3beta, increased cytoplasmic deacetylase activity and decreased tubulin acetylation. Concordantly, the administration of 5-HT, 8-OH-DPAT (a specific 5-HT1A receptor agonist), or fluoxetine (a 5-HT reuptake inhibitor) increased tubulin acetylation. GSK3beta was found to co-localize with HDAC6 in hippocampal neurons, and inhibition of GSK3beta resulted in decreased binding of antibody to phosphoserine-22, a potential GSK3beta phosphorylation site in HDAC6. GSK3beta may therefore regulate HDAC6 activity by phosphorylation.
Conclusions/significance: This study demonstrates that HDAC6 plays an important role in the modulation of mitochondrial transport. The link between HDAC6 and GSK3beta, established here, has important implications for our understanding of neurodegenerative disorders. In particular, abnormal mitochondrial transport, which has been observed in such disorders as Alzheimer's disease and Parkinson's disease, could result from the misregulation of HDAC6 by GSK3beta. HDAC6 may therefore constitute an attractive target in the treatment of these disorders.
Conflict of interest statement
Competing Interests: The authors have declared that no competing interests exist.
Figures
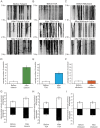
Figure 1. Inhibition of HDAC6 by tubacin dramatically promotes mitochondrial movement in hippocampal neurons.
Kymographs (A, B and C) depicting mitochondrial motility were made from Movies S1, S2, S3, S4, S5, S6, and S7, S8, S9 respectively. In the experiment, a segment of axon was imaged continuously for 3 hours with a short break to allow for administration of drugs. Images were acquired at 10-second intervals. A. Treatment with tubacin. B. Treatment with TSA. C. Treatment with niltubacin. D, E and F. Quantification of the numbers of moving mitochondrial during the period of observation (n = 6). Only mitochondria that moved through the entire field of view were counted. G, H and I. Quantification of mean velocities of moving mitochondria (n = 5).
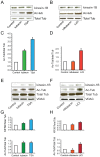
Figure 2. Changes in tubulin acetylation and association of kinesin-1B with mitochondria occur following treatment with tubacin, TSA, or LiCl.
A. Western blot analysis of kinesin-1B and acetylated tubulin levels in total cell lysates from hippocampal neuronal cultures that were treated with tubacin (20 µM) or TSA (10 µM) for one hour. B. Western blot analysis of kinesin-1B and acetylated tubulin levels in total cell lysates from hippocampal neuronal cultures that were treated with niltubacin (20 µM) or LiCl (10 mM) for one hour. C. Quantification of Western blot results shown in A (n = 3). D. Quantification of Western blot results shown in B (n = 3). E. Western blot analysis of kinesin1-B and acetylated tubulin protein levels in a mitochondrial fraction isolated from hippocampal neuronal cultures that were treated with tubacin (20 µM) or TSA (10 µM) for one hour. F. Western blot analysis of kinesin1-B and acetylated tubulin protein levels in a mitochondrial fraction from hippocampal neuronal cultures that were treated with niltubacin (20 µM) or LiCl (10 mM) for one hour. G. Quantification of Western blot results shown in E (n = 3). H. Quantification of Western blot results shown in F (n = 3). Mitochondrial protein levels were normalized to voltage-dependent anion channel (VDAC) protein levels.
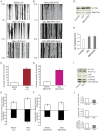
Figure 3. GSK3β activity regulates both mitochondrial movement and tubulin acetylation.
Inhibition of GSK3β by LiCl or SB216763 promotes mitochondrial movement and increases levels of acetylated tubulin, whereas activation of GSK3β via inhibition of Akt decreases levels of acetylated tubulin in hippocampal neurons. Kymographs (A and B) of mitochondrial motility correspond to Movies S10, S11, S12 and S13, S14, S15 respectively. In the experiment, a segment of axon was imaged continuously for 3 hours with short break to administer drugs. Images were acquired at 10-second intervals. A. Treatment with LiCl. B. Treatment with SB216763. C and D. Quantification of the numbers of moving mitochondria during the period of observation (n = 5). Only mitochondria that moved through the entire field of view were calculated. E and F. Quantification of mean velocities of moving mitochondria (n = 5). G. Western blot analysis of acetylated tubulin in extracts from hippocampal neurons that were treated with LiCl or SB216763. H. Quantification of Western blot shown in G. I. Western blot analysis of acetylated tubulin, phosphorylated Akt (pAkt), and phosphorylated GSK3β (pGSK3β) in extracts from hippocampal neurons that were treated with Akt inhibitor. J. Quantification of Western blot shown in I.
Figure 4. Inhibition of GSK3β decreases protein levels and activity of HDAC6 in hippocampal neurons.
A. Western blot analysis of protein levels of HDAC6 in hippocampal neurons that were treated with LiCl (10 mM) or SB216763 (2 µM) for one hour. B. Quantification of Western blot shown in A (n = 3). C. HDAC6 activity assay of total protein lysate from hippocampal neurons that were treated with LiCl (10 mM) or SB216763 (2 µM) for one hour. D. HDAC6 activity assay of total protein lysate from hippocampal neurons that were treated with Akt inhibitor VIII (5 µM) for one hour. Efficiencies of the separation of cytoplasmic and nuclear phases in C and D are shown by Western blot using anti-GAPDH antibodies.
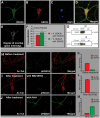
Figure 5. HDAC6 and GSK3β are co-localized in hippocampal neurons; HDAC6 serine-22 phosphorylation levels are modulated by GSK3β.
A–F. Immunostaining of HDAC6 and GSK3β in hippocampal neurons. F. Plot of co-localization generated from confocal image data collected from four neurons (six Z levels per cell; total sample size ∼24). G. Immunoprecipitation of GSK3β and HDAC6, respectively. H–J. Confocal images of immunostained acetylated tubulin and phosphorylated HDAC6 (anti-phosphoserine 22) in hippocampal neurons. H. Before treatment. I. After treatment with SB216763. J. After treatment with Akt inhibitor VIII (5 µM). K, L and M. Quantification of images H–J. Mean values of relative pixel intensities are shown.
Figure 6. 5-HT signals increase levels of Kinesin-1B and acetylated tubulin in mitochondrial fractions isolated from hippocampal neurons.
A, C. 5-HT or 8-OH-DPAT increases acetylation of tubulin in hippocampal neurons. B, D. Fluoxetine increases acetylation of tubulin in hippocampal neurons. E, F, G, H. 5-HT, 8-OH-DPAT, or fluoxetine increase the amount of kinesin1-B (top panel) and acetylated tubulin (bottom panel) found in a mitochondrially-enriched fraction. Mitochondrial protein levels were normalized to VDAC. Quantifications of Western blots were based on multiple experiments (n≥3).
Similar articles
- HDAC6 inhibitor blocks amyloid beta-induced impairment of mitochondrial transport in hippocampal neurons.
Kim C, Choi H, Jung ES, Lee W, Oh S, Jeon NL, Mook-Jung I. Kim C, et al. PLoS One. 2012;7(8):e42983. doi: 10.1371/journal.pone.0042983. Epub 2012 Aug 22. PLoS One. 2012. PMID: 22937007 Free PMC article. - Domain-selective small-molecule inhibitor of histone deacetylase 6 (HDAC6)-mediated tubulin deacetylation.
Haggarty SJ, Koeller KM, Wong JC, Grozinger CM, Schreiber SL. Haggarty SJ, et al. Proc Natl Acad Sci U S A. 2003 Apr 15;100(8):4389-94. doi: 10.1073/pnas.0430973100. Epub 2003 Apr 3. Proc Natl Acad Sci U S A. 2003. PMID: 12677000 Free PMC article. - HDAC6 α-tubulin deacetylase: a potential therapeutic target in neurodegenerative diseases.
Li G, Jiang H, Chang M, Xie H, Hu L. Li G, et al. J Neurol Sci. 2011 May 15;304(1-2):1-8. doi: 10.1016/j.jns.2011.02.017. Epub 2011 Mar 5. J Neurol Sci. 2011. PMID: 21377170 Review. - Microtubule acetylation dyshomeostasis in Parkinson's disease.
Naren P, Samim KS, Tryphena KP, Vora LK, Srivastava S, Singh SB, Khatri DK. Naren P, et al. Transl Neurodegener. 2023 May 8;12(1):20. doi: 10.1186/s40035-023-00354-0. Transl Neurodegener. 2023. PMID: 37150812 Free PMC article. Review.
Cited by
- Agomelatine (S20098) modulates the expression of cytoskeletal microtubular proteins, synaptic markers and BDNF in the rat hippocampus, amygdala and PFC.
Ladurelle N, Gabriel C, Viggiano A, Mocaër E, Baulieu EE, Bianchi M. Ladurelle N, et al. Psychopharmacology (Berl). 2012 Jun;221(3):493-509. doi: 10.1007/s00213-011-2597-5. Epub 2011 Dec 8. Psychopharmacology (Berl). 2012. PMID: 22160164 - Serotonin 1A receptor-mediated signaling through ERK and PKCα is essential for normal synaptogenesis in neonatal mouse hippocampus.
Mogha A, Guariglia SR, Debata PR, Wen GY, Banerjee P. Mogha A, et al. Transl Psychiatry. 2012 Jan 10;2(1):e66. doi: 10.1038/tp.2011.58. Transl Psychiatry. 2012. PMID: 22832728 Free PMC article. - Patient-Derived Stem Cell Models in SPAST HSP: Disease Modelling and Drug Discovery.
Wali G, Sue CM, Mackay-Sim A. Wali G, et al. Brain Sci. 2018 Jul 31;8(8):142. doi: 10.3390/brainsci8080142. Brain Sci. 2018. PMID: 30065201 Free PMC article. Review. - HDAC-6 inhibition ameliorates the early neuropathology in a mouse model of Krabbe disease.
Braz SO, Morgado MM, Pereira MI, Monteiro AC, Golonzhka O, Jarpe M, Brites P, Sousa MM, Nogueira-Rodrigues J. Braz SO, et al. Front Mol Neurosci. 2023 Jul 27;16:1231659. doi: 10.3389/fnmol.2023.1231659. eCollection 2023. Front Mol Neurosci. 2023. PMID: 37588057 Free PMC article. - SQSTM1/p62 interacts with HDAC6 and regulates deacetylase activity.
Yan J, Seibenhener ML, Calderilla-Barbosa L, Diaz-Meco MT, Moscat J, Jiang J, Wooten MW, Wooten MC. Yan J, et al. PLoS One. 2013 Sep 27;8(9):e76016. doi: 10.1371/journal.pone.0076016. eCollection 2013. PLoS One. 2013. PMID: 24086678 Free PMC article.
References
- Valenzuela-Fernandez A, Cabrero JR, Serrador JM, Sanchez-Madrid F. HDAC6: a key regulator of cytoskeleton, cell migration and cell-cell interactions. Trends Cell Biol. 2008;18:291–297. - PubMed
- Hubbert C, Guardiola A, Shao R, Kawaguchi Y, Ito A, et al. HDAC6 is a microtubule-associated deacetylase. Nature. 2002;417:455–458. - PubMed
- Reed NA, Cai D, Blasius TL, Jih GT, Meyhofer E, et al. Microtubule acetylation promotes kinesin-1 binding and transport. Curr Biol. 2006;16:2166–2172. - PubMed
Publication types
MeSH terms
Substances
LinkOut - more resources
Full Text Sources
Other Literature Sources
Molecular Biology Databases


