Cell lineage determination in state space: a systems view brings flexibility to dogmatic canonical rules - PubMed (original) (raw)
Cell lineage determination in state space: a systems view brings flexibility to dogmatic canonical rules
Sui Huang. PLoS Biol. 2010.
No abstract available
Conflict of interest statement
The author has declared that no competing interests exist.
Figures
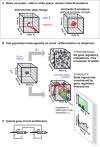
Figure 1. Fundamental principles of high-dimensional dynamical systems that may explain the coordinated change of gene expression during cell fate commitment and phenotype change and integrates chance and necessity.
(A) Basic concepts. The “cube” represents a three-dimensional state space (describing a three-gene system (genes A, B, and C) with their expression levels (xA, xB, and xC) as axes. A state S is a point in state space (blue ball). When gene expression pattern changes, the state moves along a trajectory. If gene B, which suppresses gene C, increases its expression xB, then the point S will move in the direction of the axis of increasing xB and at the same time, by necessity, of decreasing xC. (B) Application of state space and cell state concepts to a population of cells represented by a “cloud” of states. The interaction between the genes (state space dimensions) prevents the hypothetical even dispersion into the entire state space, instead allowing cells to occupy only predestined regions (cell type attractors) by following the trajectories (red). The mutual inhibition of xB and xC, for instance, pushes cells away towards an [_xB_≫_xC_] and an [_xB_≪_xC_] attractor. Yellow double arrow indicates the trajectory separation. For details see text. The insets at the bottom represent a histogram as typically observed in flow cytometry, which represents a projection of the state space for X B and the quasi-potential landscape (schematically) along X B. Note that because this is a non-integrable, non-conservative system, the elevation of the landscape does not represent true potential energy. (C) Example of a typical gene regulatory circuit of two mutually inhibiting and self-activating genes B and C (for instance Gata6 and Nanog) that establishes a metastable bipotent state xB_≈_xC that can differentiate into either one of the two committed lineage attractors, [_xB_≫_xC_] and [_xB_≪_xC_].
Comment on
- PLoS Biol. 8:e1000379.
Similar articles
- Developmental analyses of mouse embryos and adults using a non-overlapping tracing system for all three germ layers.
Serizawa T, Isotani A, Matsumura T, Nakanishi K, Nonaka S, Shibata S, Ikawa M, Okano H. Serizawa T, et al. Development. 2019 Nov 4;146(21):dev174938. doi: 10.1242/dev.174938. Development. 2019. PMID: 31597657 - Whsc1 links pluripotency exit with mesendoderm specification.
Tian TV, Di Stefano B, Stik G, Vila-Casadesús M, Sardina JL, Vidal E, Dasti A, Segura-Morales C, De Andrés-Aguayo L, Gómez A, Goldmann J, Jaenisch R, Graf T. Tian TV, et al. Nat Cell Biol. 2019 Jul;21(7):824-834. doi: 10.1038/s41556-019-0342-1. Epub 2019 Jun 24. Nat Cell Biol. 2019. PMID: 31235934 Free PMC article. - Loss of the Otx2-Binding Site in the Nanog Promoter Affects the Integrity of Embryonic Stem Cell Subtypes and Specification of Inner Cell Mass-Derived Epiblast.
Acampora D, Omodei D, Petrosino G, Garofalo A, Savarese M, Nigro V, Di Giovannantonio LG, Mercadante V, Simeone A. Acampora D, et al. Cell Rep. 2016 Jun 21;15(12):2651-64. doi: 10.1016/j.celrep.2016.05.041. Epub 2016 Jun 9. Cell Rep. 2016. PMID: 27292645 - Differential response of epiblast stem cells to Nodal and Activin signalling: a paradigm of early endoderm development in the embryo.
Kaufman-Francis K, Goh HN, Kojima Y, Studdert JB, Jones V, Power MD, Wilkie E, Teber E, Loebel DA, Tam PP. Kaufman-Francis K, et al. Philos Trans R Soc Lond B Biol Sci. 2014 Dec 5;369(1657):20130550. doi: 10.1098/rstb.2013.0550. Philos Trans R Soc Lond B Biol Sci. 2014. PMID: 25349457 Free PMC article. Review. - Developmental Competence for Primordial Germ Cell Fate.
Günesdogan U, Surani MA. Günesdogan U, et al. Curr Top Dev Biol. 2016;117:471-96. doi: 10.1016/bs.ctdb.2015.11.007. Epub 2016 Feb 18. Curr Top Dev Biol. 2016. PMID: 26969996 Review.
Cited by
- Time-variant clustering model for understanding cell fate decisions.
Huang W, Cao X, Biase FH, Yu P, Zhong S. Huang W, et al. Proc Natl Acad Sci U S A. 2014 Nov 4;111(44):E4797-806. doi: 10.1073/pnas.1407388111. Epub 2014 Oct 22. Proc Natl Acad Sci U S A. 2014. PMID: 25339442 Free PMC article. - Inferring the kinetics of stochastic gene expression from single-cell RNA-sequencing data.
Kim JK, Marioni JC. Kim JK, et al. Genome Biol. 2013 Jan 28;14(1):R7. doi: 10.1186/gb-2013-14-1-r7. Genome Biol. 2013. PMID: 23360624 Free PMC article. - Systems biology of stem cells: three useful perspectives to help overcome the paradigm of linear pathways.
Huang S. Huang S. Philos Trans R Soc Lond B Biol Sci. 2011 Aug 12;366(1575):2247-59. doi: 10.1098/rstb.2011.0008. Philos Trans R Soc Lond B Biol Sci. 2011. PMID: 21727130 Free PMC article. Review. - Exploring intermediate cell states through the lens of single cells.
MacLean AL, Hong T, Nie Q. MacLean AL, et al. Curr Opin Syst Biol. 2018 Jun;9:32-41. doi: 10.1016/j.coisb.2018.02.009. Epub 2018 Mar 2. Curr Opin Syst Biol. 2018. PMID: 30450444 Free PMC article. - Modeling the epigenetic attractors landscape: toward a post-genomic mechanistic understanding of development.
Davila-Velderrain J, Martinez-Garcia JC, Alvarez-Buylla ER. Davila-Velderrain J, et al. Front Genet. 2015 Apr 23;6:160. doi: 10.3389/fgene.2015.00160. eCollection 2015. Front Genet. 2015. PMID: 25954305 Free PMC article. Review.
References
- Rossant J. Stem cells and lineage development in the mammalian blastocyst. Reprod Fertil Dev. 2007;19:111–118. - PubMed
- Raff M. Adult stem cell plasticity: fact or artifact? Annu Rev Cell Dev Biol. 2003;19:1–22. - PubMed
- Strohman R. Epigenesis: the missing beat in biotechnology? Biotechnology (N Y) 1994;12:156–164. - PubMed
- Kaern M, Elston T. C, Blake W. J, Collins J. J. Stochasticity in gene expression: from theories to phenotypes. Nat Rev Genet. 2005;6:451–464. - PubMed
Publication types
MeSH terms
LinkOut - more resources
Full Text Sources
