A combinatorial NMR and EPR approach for evaluating the structural ensemble of partially folded proteins - PubMed (original) (raw)
A combinatorial NMR and EPR approach for evaluating the structural ensemble of partially folded proteins
Jampani Nageswara Rao et al. J Am Chem Soc. 2010.
Abstract
Partially folded proteins, characterized as exhibiting secondary structure elements with loose or absent tertiary contacts, represent important intermediates in both physiological protein folding and pathological protein misfolding. To aid in the characterization of the structural state(s) of such proteins, a novel structure calculation scheme is presented that combines structural restraints derived from pulsed EPR and NMR spectroscopy. The methodology is established for the protein alpha-synuclein (alphaS), which exhibits characteristics of a partially folded protein when bound to a micelle of the detergent sodium lauroyl sarcosinate (SLAS). By combining 18 EPR-derived interelectron spin label distance distributions with NMR-based secondary structure definitions and bond vector restraints, interelectron distances were correlated and a set of theoretical ensemble basis populations was calculated. A minimal set of basis structures, representing the partially folded state of SLAS-bound alphaS, was subsequently derived by back-calculating correlated distance distributions. A surprising variety of well-defined protein-micelle interactions was thus revealed in which the micelle is engulfed by two differently arranged antiparallel alphaS helices. The methodology further provided the population ratios between dominant ensemble structural states, whereas limitation in obtainable structural resolution arose from spin label flexibility and residual uncertainties in secondary structure definitions. To advance the understanding of protein-micelle interactions, the present study concludes by showing that, in marked contrast to secondary structure stability, helix dynamics of SLAS-bound alphaS correlate with the degree of protein-induced departures from free micelle dimensions.
Figures
Figure 1
Illustration of R1 spin label structure, incorporated R1 pairs and spin label interelectron distance distribution from 4-pulse DEER experiments. (A) Structure of the introduced nitroxide R1 side chain. Side chain dihedral angles, χ1-χ3, adopt canonical values, whereas χ4-χ5 float freely at surface sites. The nitroxide atoms are colored blue and red, respectively. (B) Residues 11, 22, 26, 37, 41, 44, 48, 52, 56, 63, 67, 70, 72, 81, 83 and 85 were R1 spin labeled. 11R1 is involved in six distance pairs, depicted in red. 56R1 is involved in four distance pairs, shown in violet. 67R1 is involved in four distance pairs, shown in cyan. The protein backbone structure depicts residues 1-93 of the subpopulation 93 C′N′/same average representative. (C) DEER dipolar evolution for the 11R1-70R1 spin label pair. The black traces denote background-corrected experimental data. The red curves depict fits using L-curve Tikhonov regularizations. (D) Resulting interelectron distance distribution. Due to the finite duration of microwave pulses, short distances become less accurate. To reach zero probability at distances below 15 Å, the distributions were extrapolated (blue curve). The distance distribution was integrated and assigned a probability of 1. Minor distribution peaks at low probabilities arise from imperfect background corrections and are unlikely to be of significance.
Figure 2
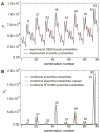
Probabilities of encountering possible combinations of SLAS-bound αS interelectron distance distribution maxima (subpopulations). (A) The probability, _P_i, of encountering a selected distance combination was calculated as the product of the corresponding probabilities of the individual DEER-derived distances (Supplementary Fig. 1) or, alternatively, the computationally implemented ensemble probabilities. (B) The conditional probability, _P_c, of encountering a selected distance combination within the configuration space of the 60,000 structure ensemble, within an independent repeat configuration space, as well as within the R2(0.990) ensemble, was quantified by counting its frequency in the respective ensemble. The listed distance combinations, 1 to 96, represent all possible combinations of distribution maxima (Supplementary Table 2). For the evaluation of individual maxima probabilities and when counting ensemble structures, respectively, distance intervals of ±3.25 Å were employed around each distribution maximum. The two relatively close maxima of 37R1-67R1 at lower distances (Fig. 4B) gave rise to observed “doublet” patterns.
Figure 3
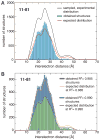
Comparison of experimental and calculated distance distributions for the 11R1-81R1 spin label pair. (A) After eliminating from the initially sampled ensemble all structures that violated a structural restraint, the distribution expected for the number of remaining valid structures did not match the distance distribution of the ensemble. (B) The expected and obtained distance distributions were realigned by randomly removing surplus structures until a target correlation coefficient, R2, between the two distributions was reached for all measured spin label pairs (Supplementary Figs. 5–6).
Figure 4
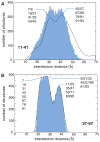
Examples of distance distribution reproduction in the R2(0.990) ensemble. (A) The 11R1-41R1 distribution, which exhibits maxima at 31.0 and 40.5 Å, is not fully self-consistent with the other distributions. (B) As exemplified for 37R1-67R1, which exhibits distribution maxima at 23.5, 26.5 and 37.5 Å, all other distributions are in good agreement (Supplementary Fig. 6). Selected subpopulations associated with the distribution maxima are indicated.
Figure 5
Comparison of DEER-derived interelectron and R2(0.990)-ensemble backbone interatom distances for 11R1-26R1 and 11R1-81R1. Interatom distances were calculated between corresponding Cα atoms. 11R1-26R1 exhibits close interelectron and interatom distance maxima at 23.0 and 22.5 Å, respectively; this implies that, at the maximum, the 11R1/26R1 spin label orientations must have been similar. Outside of distribution maxima non-equivalent rotamer combinations will dominate. Due to the possibility of interhelical distance fluctuations (helix-N′ and -C′ nano- to millisecond timescale dynamics; Supplementary Fig. 2), equivalent 11R1/81R1 rotamers could, in theory, exhibit different interelectron distances.
Figure 6
Illustration of the four theoretical helix-N′ to -C′ configurations of SLAS-bound αS. The configurations followed from relative alignment tensor orientations between the two helices and were conveniently differentiated by using the following distance, d, selection criteria. C′N′/same: d[K10(Cβ)-T72(Cβ)] > d[K12(Cβ)-T72(Cβ)], d[K10(Cβ)-T72(Cβ)] > d[K10(Cβ)-V74(Cβ)]; N′C′/same: d[K10(Cβ)-T72(Cβ)] < d[K12(Cβ)-T72(Cβ)], d[K10(Cβ)-T72(Cβ)] < d[K10(Cβ)-V74(Cβ)]; C′N′/opposite: d[K10(Cβ)-T72(Cβ)] > d[K12(Cβ)-T72(Cβ)], d[K10(Cβ)-T72(Cβ)] < d[K10(Cβ)-V74(Cβ)]; N′C′/opposite: d[K10(Cβ)-T72(Cβ)] < d[K12(Cβ)-T72(Cβ)], d[K10(Cβ)-T72(Cβ)] > d[K10(Cβ)-V74(Cβ)]. The K10(Cβ)-T72(Cβ), K12(Cβ)-T72(Cβ) and K10(Cβ)-V74(Cβ) distances are indicated by cyan, blue and red lines, respectively. Shown are the average representatives of subpopulation 93 (residues 1-93) superimposed on helix-N′, with hydrophobic helix faces colored in green.
Figure 7
Comparison of putative SLAS micelle-bound αS structural states. (A) C′N′/same average representatives of subpopulations 9, 21, 33, 45, 57, 81, 91 and 93 superimposed on helix-N′. The backbones of representatives 21, 45 and 93 are colored in blue, red and green, respectively. (B) Comparison of subpopulation 93 and 45 representatives, shown in green and red, respectively. (C) Comparison of subpopulation 21 and 93 representatives, shown in blue and green, respectively. (D) Comparison of subpopulation 21 and 9 representatives, shown in blue and magenta, respectively. (E) N′C′/same average representatives of subpopulations 9, 21, 33, 45, 57, 81, 91 and 93 superimposed on helix-N′. The backbones of representatives 21, 45 and 93 are colored in blue, red and green, respectively. The dynamically unstructured αS tail residues (94–140) are omitted for clarity.
Figure 8
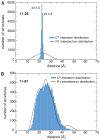
Examples of reconstructed interelectron distance distributions. (A) Results of 11R1-41R1 reconstruction for C′N′/same subpopulations 45 and 93, consisting of 15,435 and 13,510 structures, respectively. The reconstructions fit Gaussian distributions that encompass the same number of structures; subpopulation 93 exhibits a mean and standard deviation of 39.6 ± 5.1 Å, whereas, for subpopulation 45, these values are 34.9 ± 5.3 Å. The expected interelectron distribution for 15,483 structures is also shown. (B) Results of 22R1-52R1 reconstruction for subpopulation 93 in C′N′/same and N′C′/same orientation (13,510 and 14,488 structures, respectively). The expected interelectron distribution for 14,488 structures is also depicted. Of the 18 measured distance distributions, 22R1-52R1 is the only non-linked R1 pair. (C–D) Results of 11R1-70R1 reconstruction. 9/C′N′/same, 21/C′N′/same, 45/C′N′/same and 93/N′C′/same populate their correct target distance maximum, as indicated.
Figure 9
Mode of αS-SLAS micelle binding and RDC averaging. (A–B) Comparison of SLAS micelle and αS dimensions. Free SLAS micelles exhibit an unhydrated radius of 22.2 Å. A sphere of such radius, shown in red, and a spheroid of equal volume, shown in cyan, were placed on the C′N′/same and N′C′/same average representatives of subpopulations 9 and 93, shown in magenta and green, respectively. The hydrophobic helix faces are colored to identify the micelle binding surfaces. Selected amino acid positions are indicated. The dynamically unstructured αS tail residues (94–140) are omitted for clarity. The two views depicted are related by a 90° rotation around the x-axis. The spheroid shown exhibits minor and major axes of 17.5 and 35.7 Å, respectively. The helices may immerse into an SDS micelle as deeply as detergent hydrocarbons 3 and 4., (C–D) Evaluation of RDC averaging. For predicted 9/C′N′/same and 93/N′C′/same 1_D_CαC′ couplings (see main text), a correlation coefficient, R, of 0.882 was obtained, which illustrates that averaging will improve 9/C′N′/same RDC fits to 93/N′C′/same coordinates and vice versa. Averaged RDC exhibit constant alignment tensor magnitude, Da, for fits to 7-residue backbone fragments of 9/C′N′/same or 93/N′C′/same, except for the helix-helix connector (residues 33–41). For comparison, Da values for experimental RDC are shown; these were obtained by MFR, as described previously., Fragments are denoted by their center residue.
Similar articles
- Insight into α-synuclein plasticity and misfolding from differential micelle binding.
Mazumder P, Suk JE, Ulmer TS. Mazumder P, et al. J Phys Chem B. 2013 Oct 3;117(39):11448-59. doi: 10.1021/jp402589x. Epub 2013 Sep 12. J Phys Chem B. 2013. PMID: 23978162 Free PMC article. - Broken helix in vesicle and micelle-bound alpha-synuclein: insights from site-directed spin labeling-EPR experiments and MD simulations.
Bortolus M, Tombolato F, Tessari I, Bisaglia M, Mammi S, Bubacco L, Ferrarini A, Maniero AL. Bortolus M, et al. J Am Chem Soc. 2008 May 28;130(21):6690-1. doi: 10.1021/ja8010429. Epub 2008 May 6. J Am Chem Soc. 2008. PMID: 18457394 - Spin-label EPR on alpha-synuclein reveals differences in the membrane binding affinity of the two antiparallel helices.
Drescher M, Godschalk F, Veldhuis G, van Rooijen BD, Subramaniam V, Huber M. Drescher M, et al. Chembiochem. 2008 Oct 13;9(15):2411-6. doi: 10.1002/cbic.200800238. Chembiochem. 2008. PMID: 18821550 - High-field EPR on membrane proteins - crossing the gap to NMR.
Möbius K, Lubitz W, Savitsky A. Möbius K, et al. Prog Nucl Magn Reson Spectrosc. 2013 Nov;75:1-49. doi: 10.1016/j.pnmrs.2013.07.002. Epub 2013 Jul 29. Prog Nucl Magn Reson Spectrosc. 2013. PMID: 24160760 Review. - Combined NMR and EPR spectroscopy to determine structures of viral fusion domains in membranes.
Tamm LK, Lai AL, Li Y. Tamm LK, et al. Biochim Biophys Acta. 2007 Dec;1768(12):3052-60. doi: 10.1016/j.bbamem.2007.09.010. Epub 2007 Sep 25. Biochim Biophys Acta. 2007. PMID: 17963720 Free PMC article. Review.
Cited by
- Predictive Modeling of Neurotoxic α-Synuclein Polymorphs.
Xu L, Bhattacharya S, Thompson D. Xu L, et al. Methods Mol Biol. 2022;2340:379-399. doi: 10.1007/978-1-0716-1546-1_17. Methods Mol Biol. 2022. PMID: 35167083 - Methylphenidate Analogues as a New Class of Potential Disease-Modifying Agents for Parkinson's Disease: Evidence from Cell Models and Alpha-Synuclein Transgenic Mice.
Casiraghi A, Longhena F, Faustini G, Ribaudo G, Suigo L, Camacho-Hernandez GA, Bono F, Brembati V, Newman AH, Gianoncelli A, Straniero V, Bellucci A, Valoti E. Casiraghi A, et al. Pharmaceutics. 2022 Jul 30;14(8):1595. doi: 10.3390/pharmaceutics14081595. Pharmaceutics. 2022. PMID: 36015221 Free PMC article. - Advances in studying protein disorder with solid-state NMR.
Siemer AB. Siemer AB. Solid State Nucl Magn Reson. 2020 Apr;106:101643. doi: 10.1016/j.ssnmr.2020.101643. Epub 2020 Jan 12. Solid State Nucl Magn Reson. 2020. PMID: 31972419 Free PMC article. Review. - High-speed atomic force microscopy reveals structural dynamics of α-synuclein monomers and dimers.
Zhang Y, Hashemi M, Lv Z, Williams B, Popov KI, Dokholyan NV, Lyubchenko YL. Zhang Y, et al. J Chem Phys. 2018 Mar 28;148(12):123322. doi: 10.1063/1.5008874. J Chem Phys. 2018. PMID: 29604892 Free PMC article. - Specificity and kinetics of alpha-synuclein binding to model membranes determined with fluorescent excited state intramolecular proton transfer (ESIPT) probe.
Shvadchak VV, Falomir-Lockhart LJ, Yushchenko DA, Jovin TM. Shvadchak VV, et al. J Biol Chem. 2011 Apr 15;286(15):13023-32. doi: 10.1074/jbc.M110.204776. Epub 2011 Feb 17. J Biol Chem. 2011. PMID: 21330368 Free PMC article.
References
- Onuchic JN, Wolynes PG. Curr Opin Struct Biol. 2004;14:70–75. - PubMed
- Young JC, Agashe VR, Siegers K, Hartl FU. Nat Rev Mol Cell Biol. 2004;5:781–791. - PubMed
- Lashuel HA, Lansbury PT. Q Rev Biophys. 2006;39:167–201. - PubMed
Publication types
MeSH terms
Substances
Grants and funding
- R01 AG027936-03/AG/NIA NIH HHS/United States
- R01 HL089726/HL/NHLBI NIH HHS/United States
- R01 HL089726-03/HL/NHLBI NIH HHS/United States
- R01 AG027936/AG/NIA NIH HHS/United States
- HL089726/HL/NHLBI NIH HHS/United States
- AG027936/AG/NIA NIH HHS/United States
LinkOut - more resources
Full Text Sources
Molecular Biology Databases


