alpha-hydroxybutyrate is an early biomarker of insulin resistance and glucose intolerance in a nondiabetic population - PubMed (original) (raw)
. 2010 May 28;5(5):e10883.
doi: 10.1371/journal.pone.0010883.
Kirk Beebe, Kay A Lawton, Klaus-Peter Adam, Matthew W Mitchell, Pamela J Nakhle, John A Ryals, Michael V Milburn, Monica Nannipieri, Stefania Camastra, Andrea Natali, Ele Ferrannini; RISC Study Group
Affiliations
- PMID: 20526369
- PMCID: PMC2878333
- DOI: 10.1371/journal.pone.0010883
alpha-hydroxybutyrate is an early biomarker of insulin resistance and glucose intolerance in a nondiabetic population
Walter E Gall et al. PLoS One. 2010.
Abstract
Background: Insulin resistance is a risk factor for type 2 diabetes and cardiovascular disease progression. Current diagnostic tests, such as glycemic indicators, have limitations in the early detection of insulin resistant individuals. We searched for novel biomarkers identifying these at-risk subjects.
Methods: Using mass spectrometry, non-targeted biochemical profiling was conducted in a cohort of 399 nondiabetic subjects representing a broad spectrum of insulin sensitivity and glucose tolerance (based on the hyperinsulinemic euglycemic clamp and oral glucose tolerance testing, respectively).
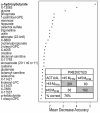
Results: Random forest statistical analysis selected alpha-hydroxybutyrate (alpha-HB) as the top-ranked biochemical for separating insulin resistant (lower third of the clamp-derived M(FFM) = 33 [12] micromol x min(-1) x kg(FFM) (-1), median [interquartile range], n = 140) from insulin sensitive subjects (M(FFM) = 66 [23] micromol x min(-1) x kg(FFM) (-1)) with a 76% accuracy. By targeted isotope dilution assay, plasma alpha-HB concentrations were reciprocally related to M(FFM); and by partition analysis, an alpha-HB value of 5 microg/ml was found to best separate insulin resistant from insulin sensitive subjects. alpha-HB also separated subjects with normal glucose tolerance from those with impaired fasting glycemia or impaired glucose tolerance independently of, and in an additive fashion to, insulin resistance. These associations were also independent of sex, age and BMI. Other metabolites from this global analysis that significantly correlated to insulin sensitivity included certain organic acid, amino acid, lysophospholipid, acylcarnitine and fatty acid species. Several metabolites are intermediates related to alpha-HB metabolism and biosynthesis.
Conclusions: alpha-hydroxybutyrate is an early marker for both insulin resistance and impaired glucose regulation. The underlying biochemical mechanisms may involve increased lipid oxidation and oxidative stress.
Conflict of interest statement
Competing Interests: W. Gall, K. Beebe, K. Lawton, K-P. Adam, M. Mitchell, P. Nakhle, John Ryals, and Mike Milburn are employees of Metabolon, Inc., a private company. M. Nannipieri, S. Camastra, A. Natali, and E. Ferrannini are faculty of University of Pisa School of Medicine.
Figures
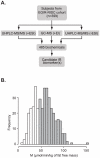
Figure 1. Global biochemical profiling analysis of a nondiabetic population.
A. Metabolomic analysis schema. Plasma samples collected from 399 fasting nondiabetic subjects were analyzed on three separate mass spectrometry platforms. Ultra-high pressure liquid chromatography-mass spectrometry (UHPLC-MS) was performed in positive (+ESI) and negative (-ESI) ionization mode and gas chromatography (GC-MS) in positive ionization mode (+EI). An average of ∼485 biochemicals was measured in each sample. B. The distribution of insulin-mediated glucose disposal rates, expressed as MFFM values (µmol·min−1·kgFFM −1), of 399 subjects selected from the RISC cohort and comprised of NGT, IGT, and IFG subjects. IR was defined as M≤45 µmol·min−1·kgFFM −1 as measured by clamp, representing the bottom third of the entire RISC cohort (n = 1293). Shaded bars insulin sensitive (IS); open bars insulin resistant (IR).
Figure 2. Classification of subjects as insulin sensitive or insulin resistant.
Random Forest statistical analysis of biochemical profiling (metabolomic) data. The Importance Plot rank of metabolites according to the contribution of each to the classification of 399 subjects into insulin sensitive (IS, MFFM>45 µmol·min−1·kgFFM −1, top two-thirds of subjects, n = 261) or insulin resistant (IR, MFFM<45 µmol·min−1·kgFFM −1, bottom third of subjects, n = 138) groups. Metabolites are listed on the y-axis in order of importance, decreasing in importance from the top to bottom. The mean decrease in accuracy for each metabolite is plotted on x-axis. INSET: The Confusion Matrix showing the prediction accuracy of the separation of the top two-thirds (IS) from the bottom third (IR) is ∼76%.
Figure 3. α-HB levels are higher in insulin resistant subjects in both screening and targeted assays.
A. Box plot of α-HB levels measured in the non-targeted MS analysis (screening data). The X-axis shows the groups and the Y-axis shows the relative normalized intensity for α-HB median scaled to 1. B. Box plot of α-HB concentrations measured using targeted isotopic dilution assays (targeted data). The X-axis shows the groups and the Y-axis shows α-HB concentration in µg/ml. In the box plots the top and bottom of the box represent the 75th and 25th percentile, respectively. The top and bottom bars (“whiskers”) represent the entire spread of the data points for α-HB and each group, excluding “extreme” points, which are indicated with black squares. The black arrowheads indicate the mean value and the gray arrowheads indicate the median value.
Figure 4. Classification of subjects according to insulin sensitivity and plasma glucose regulation.
Schema showing the partitioning of the 399 subjects into groups according to the results of the oral glucose tolerance test (OGTT), fasting plasma glucose levels (FPG) and M values derived from the clamp. NGT, normal glucose tolerant; IGT, impaired glucose tolerant; NGT-IS, normal glucose tolerant and insulin sensitive (MFFM>45 µmol·min−1·kgFFM −1); NGT-IR, normal glucose tolerant and insulin resistant (MFFM≤45 µmol·min−1·kgFFM −1); IFG, normal glucose tolerant and impaired fasting glucose.
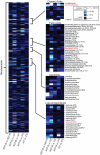
Figure 5. Biochemicals showing significant change in subjects with IR and/or dysglycemia.
A heat map graphical representation of _p_-values obtained from statistical analysis of the global biochemical profiling of metabolites measured in plasma collected from NGT-IS, NGT-IR, IGT, and IFG subjects. _t_-tests were performed to determine those metabolites that significantly increase or decrease in insulin resistant (IR) and dysglycemic individuals (IGT, IFG). Highlighted from the main heat map include an organic acid, α-HB, the top-ranked biochemical for separating NGT-IS from NGT-IR and NGT-IS from IGT; a cluster of long-chain fatty acids such as palmitate that are pronounced when comparing NGT-IS to IGT; and acyl-carnitines and acylglycerophosphocholines that distinguish NGT-IR and IGT from NGT-IS. The color coding used, from white to dark blue, indicate the most significant to least significant, respectively, with white, most statistically significant (_p_≤1.0E-16); light blue (1.0E-16≤_p_≤0.001), royal blue (0.001≤_p_≤0.01), and dark blue, not significant (_p_≥0.1).
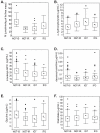
Figure 6. Insulin-mediatedglucose disposal rates and representative metabolite levels in insulin resistant and dysglycemic subjects.
A. Box plots of insulin-mediated glucose disposal rates (MFFM, µmol·min−1·kgFFM −1); derived from the clamp in normoglycemic (NGT) and dysglycemic (IGT, FPG) subjects. B. – F. Box plots of concentrations (µg/ml) of representative metabolites that change significantly with insulin resistance and/or dysglycemia as measured by isotopic dilution assays in subjects with normal glucose tolerance that are insulin sensitive (NGT-IS) or insulin resistant (NGT-IS) and in dysglycemic subjects with impaired glucose tolerance (IGT) or impaired fasting plasma glucose levels (IFG). B. α-HB, C. linoleoyl-GPC, D. decanoyl-carnitine, E. glycine, F. palmitate.
Figure 7. A Model of the biochemical relationship of α-HB biosynthesis and associated metabolic pathways with Insulin Resistance.
α-HB is produced from the conversion of α-KB in a reaction catalyzed by LDH that occurs when the NADH/NAD+ ratio is elevated, as can occur from higher lipid oxidation events. Metabolites that change significantly (screening and targeted data, p<0.01) are indicated by a box; arrows indicate the direction of change. α-HB, alpha-hydroxybutyrate; α-KB, alpha-ketobutyrate; BCAA, branched chain amino acids; BCKDH, branched chain alpha keto acid dehydrogenase; CBS, cystathionine-beta-synthase; CGL, cystathionine gamma-lyase; HBDH, α-hydroxybutyrate dehydrogenase; LDH, lactate dehydrogenase; SAH, S-adenosyl-L-homocysteine; SAM, S-adenosyl Methionine. All compounds in boxes were measured using targeted assays, with the exception of α-KB, cysteine and BCAAs.
Similar articles
- α-Hydroxybutyric Acid Is a Selective Metabolite Biomarker of Impaired Glucose Tolerance.
Cobb J, Eckhart A, Motsinger-Reif A, Carr B, Groop L, Ferrannini E. Cobb J, et al. Diabetes Care. 2016 Jun;39(6):988-95. doi: 10.2337/dc15-2752. Epub 2016 Apr 5. Diabetes Care. 2016. PMID: 27208342 - Early metabolic markers of the development of dysglycemia and type 2 diabetes and their physiological significance.
Ferrannini E, Natali A, Camastra S, Nannipieri M, Mari A, Adam KP, Milburn MV, Kastenmüller G, Adamski J, Tuomi T, Lyssenko V, Groop L, Gall WE. Ferrannini E, et al. Diabetes. 2013 May;62(5):1730-7. doi: 10.2337/db12-0707. Epub 2012 Nov 16. Diabetes. 2013. PMID: 23160532 Free PMC article. - The amino acid response to a mixed meal in patients with type 2 diabetes: effect of sitagliptin treatment.
Muscelli E, Frascerra S, Casolaro A, Baldi S, Mari A, Gall W, Cobb J, Ferrannini E. Muscelli E, et al. Diabetes Obes Metab. 2014 Nov;16(11):1140-7. doi: 10.1111/dom.12350. Epub 2014 Aug 4. Diabetes Obes Metab. 2014. PMID: 25040945 Clinical Trial. - Oral vanadyl sulfate improves insulin sensitivity in NIDDM but not in obese nondiabetic subjects.
Halberstam M, Cohen N, Shlimovich P, Rossetti L, Shamoon H. Halberstam M, et al. Diabetes. 1996 May;45(5):659-66. doi: 10.2337/diab.45.5.659. Diabetes. 1996. PMID: 8621019 Clinical Trial. - A novel test for IGT utilizing metabolite markers of glucose tolerance.
Cobb J, Eckhart A, Perichon R, Wulff J, Mitchell M, Adam KP, Wolfert R, Button E, Lawton K, Elverson R, Carr B, Sinnott M, Ferrannini E. Cobb J, et al. J Diabetes Sci Technol. 2015 Jan;9(1):69-76. doi: 10.1177/1932296814553622. Epub 2014 Sep 26. J Diabetes Sci Technol. 2015. PMID: 25261439 Free PMC article.
Cited by
- Prospective study of changes in the metabolomic profiles of men during their first three months of androgen deprivation therapy for prostate cancer.
Saylor PJ, Karoly ED, Smith MR. Saylor PJ, et al. Clin Cancer Res. 2012 Jul 1;18(13):3677-85. doi: 10.1158/1078-0432.CCR-11-3209. Epub 2012 May 15. Clin Cancer Res. 2012. PMID: 22589396 Free PMC article. - Association of ketone body levels with hyperglycemia and type 2 diabetes in 9,398 Finnish men.
Mahendran Y, Vangipurapu J, Cederberg H, Stancáková A, Pihlajamäki J, Soininen P, Kangas AJ, Paananen J, Civelek M, Saleem NK, Pajukanta P, Lusis AJ, Bonnycastle LL, Morken MA, Collins FS, Mohlke KL, Boehnke M, Ala-Korpela M, Kuusisto J, Laakso M. Mahendran Y, et al. Diabetes. 2013 Oct;62(10):3618-26. doi: 10.2337/db12-1363. Epub 2013 Apr 4. Diabetes. 2013. PMID: 23557707 Free PMC article. - Integrative metabolomics dictate distinctive signature profiles in patients with Tetralogy of Fallot.
Li Y, Tian M, Zhou Z, Tu J, Zhang R, Huang Y, Zhang Y, Cui H, Zhuang J, Chen J. Li Y, et al. Pediatr Res. 2024 Jun 29. doi: 10.1038/s41390-024-03328-8. Online ahead of print. Pediatr Res. 2024. PMID: 38951655 - What Have We Learned from Cerebrospinal Fluid Studies about Biomarkers for Detecting LRRK2 Parkinson's Disease Patients and Healthy Subjects with Parkinson's-Associated LRRK2 Mutations?
Loeffler DA, Aasly JO, LeWitt PA, Coffey MP. Loeffler DA, et al. J Parkinsons Dis. 2019;9(3):467-488. doi: 10.3233/JPD-191630. J Parkinsons Dis. 2019. PMID: 31322581 Free PMC article. Review. - Validation of a Microwave-Assisted Derivatization Gas Chromatography-Mass Spectrometry Method for the Quantification of 2-Hydroxybutyrate in Human Serum as an Early Marker of Diabetes Mellitus.
Rodríguez-García M, Fernández-Varo G, Hidalgo S, Rodríguez G, Martínez I, Zeng M, Casals E, Morales-Ruiz M, Casals G. Rodríguez-García M, et al. Molecules. 2022 Mar 15;27(6):1889. doi: 10.3390/molecules27061889. Molecules. 2022. PMID: 35335253 Free PMC article.
References
- Ginsberg H, Olefsky JM, Reaven GM. Further evidence that insulin resistance exists in patients with chemical diabetes. Diabetes. 1974;23:674–678. - PubMed
- Harris MI. Epidemiologic studies on the pathogenesis of non-insulin-dependent diabetes mellitus (NIDDM). Clin Invest Med. 1995;18:231–239. - PubMed
- Lyssenko V, Jonsson A, Almgren P, Pulizzi N, Isomaa B, et al. Clinical risk factors, DNA variants, and the development of type 2 diabetes. N Engl J Med. 2008;359:2220–2232. - PubMed
- Reaven GM, Olefsky JM. The role of insulin resistance in the pathogenesis of diabetes mellitus. Adv Metab Disord. 1978;9:313–331. - PubMed
Publication types
MeSH terms
Substances
LinkOut - more resources
Full Text Sources
Other Literature Sources
Medical
Miscellaneous


