3D PIB and CSF biomarker associations with hippocampal atrophy in ADNI subjects - PubMed (original) (raw)
Comparative Study
. 2010 Aug;31(8):1284-303.
doi: 10.1016/j.neurobiolaging.2010.05.003. Epub 2010 Jun 11.
Kristy S Hwang, John P Andrawis, Amity E Green, Sona Babakchanian, Jonathan H Morra, Jeffrey L Cummings, Arthur W Toga, John Q Trojanowski, Leslie M Shaw, Clifford R Jack Jr, Ronald C Petersen, Paul S Aisen, William J Jagust, Robert A Koeppe, Chester A Mathis, Michael W Weiner, Paul M Thompson; Alzheimer's Disease Neuroimaging Initiative
Affiliations
- PMID: 20538372
- PMCID: PMC3051831
- DOI: 10.1016/j.neurobiolaging.2010.05.003
Comparative Study
3D PIB and CSF biomarker associations with hippocampal atrophy in ADNI subjects
Liana G Apostolova et al. Neurobiol Aging. 2010 Aug.
Abstract
Cerebrospinal fluid (CSF) measures of Ab and tau, Pittsburgh Compound B (PIB) imaging and hippocampal atrophy are promising Alzheimer's disease biomarkers yet the associations between them are not known. We applied a validated, automated hippocampal labeling method and 3D radial distance mapping to the 1.5T structural magnetic resonance imaging (MRI) data of 388 ADNI subjects with baseline CSF Ab(42), total tau (t-tau) and phosphorylated tau (p-tau(181)) and 98 subjects with positron emission tomography (PET) imaging using PIB. We used linear regression to investigate associations between hippocampal atrophy and average cortical, parietal and precuneal PIB standardized uptake value ratio (SUVR) and CSF Ab(42), t-tau, p-tau(181), t-tau/Ab(42) and p-tau(181)/Ab(42). All CSF measures showed significant associations with hippocampal volume and radial distance in the pooled sample. Strongest correlations were seen for p-tau(181), followed by p-tau(181)/Ab(42) ratio, t-tau/Ab(42) ratio, t-tau and Ab(42). p-tau(181) showed stronger correlation in ApoE4 carriers, while t-tau showed stronger correlation in ApoE4 noncarriers. Of the 3 PIB measures the precuneal SUVR showed strongest associations with hippocampal atrophy.
2010. Published by Elsevier Inc.
Figures
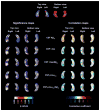
Fig. 1
Three-dimensional (3D) statistical maps of the associations between cerebrospinal fluid (CSF) biomarkers and hippocampal radial distance (for areas in red and white p < 0.05). For permutation corrected significance values see Table 2.
Fig. 2
Three-dimensional (3D) statistical maps of the associations between cerebrospinal fluid (CSF) biomarkers and hippocampal radial distance in normal control (NC), mild cognitive impairment (MCI), and Alzheimer’s disease (AD) (for areas in red and white p < 0.05).
Fig. 3
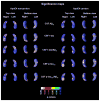
Three-dimensional (3D) statistical maps of the associations between cerebrospinal fluid (CSF) biomarkers and hippocampal radial distance in ApoE4 carriers and noncarriers (for areas in red and white p < 0.05).
Fig. 4
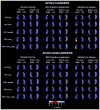
Three-dimensional (3D) statistical maps of the associations between cerebrospinal fluid (CSF) biomarkers and hippocampal radial distance in ApoE4 carriers and noncarriers within each diagnostic category (for areas in red and white p < 0.05).
Fig. 5
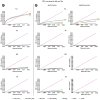
Cumulative distribution function (CDF) plots comparing the strengths of the associations between the cerebrospinal fluid (CSF) biomarker measures and hippocampal radial distance in the pooled sample (A) and in each diagnostic group (B). The y = 20× line denotes the threshold that controls the allowed 5% false discovery rate (FDR) (i.e., the maximum proportion of false positives allowed, by convention, for a map to be declared significant overall).
Fig. 6
Three-dimensional (3D) statistical maps of the associations between the 3 Pittsburgh Compound B (PIB) biomarkers and hippocampal radial distance (for areas in red and white p < 0.05).
Fig. 7
Three-dimensional (3D) statistical maps of the associations between Pittsburgh Compound B (PIB) biomarkers and hippocampal radial distance in ApoE4 carriers and noncarriers (for areas in red and white p < 0.05).
Fig. 8
Three-dimensional (3D) statistical maps of the associations between cerebrospinal fluid (CSF) amyloid beta (A_β_)42 and the 3 Pittsburgh Compound B (PIB) biomarkers and hippocampal radial distance in the combined CSF/PIB sample (for areas in red and white p < 0.05).
Similar articles
- Analysis of Cerebrospinal Fluid and [11C]PIB PET Biomarkers for Alzheimer's Disease with Updated Protocols.
Wang MJ, Yi S, Han JY, Park SY, Jang JW, Chun IK, Giau VV, Bagyinszky E, Lim KT, Kang SM, An SS, Park YH, Youn YC, Kim S. Wang MJ, et al. J Alzheimers Dis. 2016 May 6;52(4):1403-13. doi: 10.3233/JAD-160143. J Alzheimers Dis. 2016. PMID: 27163824 - Comparison of Diagnostic Performances Between Cerebrospinal Fluid Biomarkers and Amyloid PET in a Clinical Setting.
Jung NY, Kim ES, Kim HS, Jeon S, Lee MJ, Pak K, Lee JH, Lee YM, Lee K, Shin JH, Ko JK, Lee JM, Yoon JA, Hwang C, Choi KU, Lee EC, Seong JK, Huh GY, Kim DS, Kim EJ. Jung NY, et al. J Alzheimers Dis. 2020;74(2):473-490. doi: 10.3233/JAD-191109. J Alzheimers Dis. 2020. PMID: 32039853 - Sequence of Alzheimer disease biomarker changes in cognitively normal adults: A cross-sectional study.
Luo J, Agboola F, Grant E, Masters CL, Albert MS, Johnson SC, McDade EM, Vöglein J, Fagan AM, Benzinger T, Massoumzadeh P, Hassenstab J, Bateman RJ, Morris JC, Perrin RJ, Chhatwal J, Jucker M, Ghetti B, Cruchaga C, Graff-Radford NR, Schofield PR, Mori H, Xiong C. Luo J, et al. Neurology. 2020 Dec 8;95(23):e3104-e3116. doi: 10.1212/WNL.0000000000010747. Epub 2020 Sep 1. Neurology. 2020. PMID: 32873693 Free PMC article. - Longitudinal β-Amyloid Deposition and Hippocampal Volume in Preclinical Alzheimer Disease and Suspected Non-Alzheimer Disease Pathophysiology.
Gordon BA, Blazey T, Su Y, Fagan AM, Holtzman DM, Morris JC, Benzinger TL. Gordon BA, et al. JAMA Neurol. 2016 Oct 1;73(10):1192-1200. doi: 10.1001/jamaneurol.2016.2642. JAMA Neurol. 2016. PMID: 27548756 Free PMC article. - Alzheimer's Disease Normative Cerebrospinal Fluid Biomarkers Validated in PET Amyloid-β Characterized Subjects from the Australian Imaging, Biomarkers and Lifestyle (AIBL) study.
Li QX, Villemagne VL, Doecke JD, Rembach A, Sarros S, Varghese S, McGlade A, Laughton KM, Pertile KK, Fowler CJ, Rumble RL, Trounson BO, Taddei K, Rainey-Smith SR, Laws SM, Robertson JS, Evered LA, Silbert B, Ellis KA, Rowe CC, Macaulay SL, Darby D, Martins RN, Ames D, Masters CL, Collins S; AIBL Research Group. Li QX, et al. J Alzheimers Dis. 2015;48(1):175-87. doi: 10.3233/JAD-150247. J Alzheimers Dis. 2015. PMID: 26401938
Cited by
- CSF biomarker associations with change in hippocampal volume and precuneus thickness: implications for the Alzheimer's pathological cascade.
Stricker NH, Dodge HH, Dowling NM, Han SD, Erosheva EA, Jagust WJ; Alzheimer’s Disease Neuroimaging Initiative. Stricker NH, et al. Brain Imaging Behav. 2012 Dec;6(4):599-609. doi: 10.1007/s11682-012-9171-6. Brain Imaging Behav. 2012. PMID: 22614327 Free PMC article. - The Alzheimer's Disease Neuroimaging Initiative: a review of papers published since its inception.
Weiner MW, Veitch DP, Aisen PS, Beckett LA, Cairns NJ, Green RC, Harvey D, Jack CR, Jagust W, Liu E, Morris JC, Petersen RC, Saykin AJ, Schmidt ME, Shaw L, Shen L, Siuciak JA, Soares H, Toga AW, Trojanowski JQ; Alzheimer's Disease Neuroimaging Initiative. Weiner MW, et al. Alzheimers Dement. 2013 Sep;9(5):e111-94. doi: 10.1016/j.jalz.2013.05.1769. Epub 2013 Aug 7. Alzheimers Dement. 2013. PMID: 23932184 Free PMC article. Review. - Identification of Alzheimer's disease and mild cognitive impairment using multimodal sparse hierarchical extreme learning machine.
Kim J, Lee B. Kim J, et al. Hum Brain Mapp. 2018 Sep;39(9):3728-3741. doi: 10.1002/hbm.24207. Epub 2018 May 7. Hum Brain Mapp. 2018. PMID: 29736986 Free PMC article. - The hippocampal network model: A transdiagnostic metaconnectomic approach.
Kotkowski E, Price LR, Mickle Fox P, Vanasse TJ, Fox PT. Kotkowski E, et al. Neuroimage Clin. 2018 Jan 8;18:115-129. doi: 10.1016/j.nicl.2018.01.002. eCollection 2018. Neuroimage Clin. 2018. PMID: 29387529 Free PMC article. - A Subset of Cerebrospinal Fluid Proteins from a Multi-Analyte Panel Associated with Brain Atrophy, Disease Classification and Prediction in Alzheimer's Disease.
Khan W, Aguilar C, Kiddle SJ, Doyle O, Thambisetty M, Muehlboeck S, Sattlecker M, Newhouse S, Lovestone S, Dobson R, Giampietro V, Westman E, Simmons A; Alzheimer’s Disease Neuroimaging Initiative. Khan W, et al. PLoS One. 2015 Aug 18;10(8):e0134368. doi: 10.1371/journal.pone.0134368. eCollection 2015. PLoS One. 2015. PMID: 26284520 Free PMC article.
References
- Andreasen N, Minthon L, Davidsson P, Vanmechelen E, Vanderstichele H, Winblad B, Blennow K. Evaluation of CSF-tau and CSF-Abeta42 as diagnostic markers for Alzheimer disease in clinical practice. Arch Neurol. 2001;58:373–379. - PubMed
- Apostolova LG, Dinov ID, Dutton RA, Hayashi KM, Toga AW, Cummings JL, Thompson PM. 3D comparison of hippocampal atrophy in amnestic mild cognitive impairment and Alzheimer’s disease. Brain. 2006a;129:2867–2873. - PubMed
- Apostolova LG, Dutton RA, Dinov ID, Hayashi KM, Toga AW, Cummings JL, Thompson PM. Conversion of mild cognitive impairment to Alzheimer disease predicted by hippocampal atrophy maps. Arch Neurol. 2006b;63:693–699. - PubMed
- Apostolova LG, Morra JH, Green AE, Hwang KS, Avedissian C, Woo E, Cummings JL, Toga AW, Jack CR, Weiner MW, Thompson PM. Automated 3D mapping of baseline and 12-month associations between three verbal memory measures and hippocampal atrophy in 490 ADNI subjects. Neuroimage. 2010;15:488–499. - PMC - PubMed
Publication types
MeSH terms
Substances
Grants and funding
- K01 AG030514/AG/NIA NIH HHS/United States
- P50 AG16570/AG/NIA NIH HHS/United States
- EB01651/EB/NIBIB NIH HHS/United States
- K23 AG026803/AG/NIA NIH HHS/United States
- P41 RR013642/RR/NCRR NIH HHS/United States
- U54 RR021813/RR/NCRR NIH HHS/United States
- LM05639/LM/NLM NIH HHS/United States
- P30 AG010129/AG/NIA NIH HHS/United States
- R01 MH071940/MH/NIMH NIH HHS/United States
- T35 AG026736/AG/NIA NIH HHS/United States
- R21 RR019771/RR/NCRR NIH HHS/United States
- R01 LM005639/LM/NLM NIH HHS/United States
- U01 AG024904/AG/NIA NIH HHS/United States
- U19 AG010483/AG/NIA NIH HHS/United States
- RR019771/RR/NCRR NIH HHS/United States
- P50 AG016570/AG/NIA NIH HHS/United States
LinkOut - more resources
Full Text Sources
Other Literature Sources
Medical


